.png)


.png)
Summary
It’s been a busy week of Central Bank announcements that definitely hasn’t done the market any favors.
The Federal Reserve on Wednesday engineered a hawkish pause, holding interest rates steady while indicating a majority of officials expect one more quarter-point interest rate hike before the end of the year. At the same time, the Fed sent a clear message that interest rates were expected to be “higher for longer” by cutting its forecast for rate cuts in 2024 from four to two. As a result, officials see their benchmark rate rate still slightly above 5% by the end of next year.
Wall Street had its worst week since March. Treasury yields moved sharply higher, as both the 2-year (which is more sensitive to moves in the fed funds rate) and 10-year yields moved to highs of this cycle, putting downward pressure on stock and bond returns. Longer-duration parts of the market, including technology and growth sectors, underperformed the broader market. The SP 500 and the Nasdaq posted weekly declines of around 3% to 4%, retreating for the third week in a row. The setbacks were driven by steep declines on Wednesday afternoon and on Thursday in the wake of the latest U.S. Federal Reserve meeting.
With the United Kingdom’s steep inflation rate easing, the Bank of England kept its benchmark interest rate unchanged after raising it for the previous 14 meetings. The bank had been hiking rates consistently since December 2021 in a bid to rein in inflation, but it opted on Thursday to keep its rate unchanged after inflation slipped to an annual 6.7% rate in August.
Japan’s central bank kept the nation’s main interest-rate targets unchanged, with the bank’s governor, Kazuo Ueda, citing deflationary risks if it tightens monetary policy too soon. Friday’s decision came as Ueda said he planned to keep a benchmark short-term interest rate in negative territory for now,the same level that it’s been since 2016.
The latest updates on home prices in the U.S. will come out next week, along with new and pending home sales for August. Federal Reserve Chair Jerome Powell will hold a town hall-style event with educators on Thursday, and on Friday, we’ll get the Personal Consumption Expenditures (PCE) Price Index, the Fed’s preferred inflation gauge.
It has been a quiet week of caution for Bitcoin traders in terms of price action despite this crucial Fed meeting. This caution has trickled into trading volume in particular, as volumes on major crypto exchanges for both spot Bitcoin trading and Bitcoin derivatives have fallen far below their levels at the beginning of the year.
On-chain data from CryptoQuant charts have shown the daily spot and derivatives trading volume of Bitcoin has been steadily declining since the first quarter of the year. The question is, what does this collapse in trading volumes mean for the future price of Bitcoin?
Macro y news
Economic Calendar:

Upcoming relevant events:
SEPTEMBER
▪️29: PCE
▪️30: End Government Fiscal Year. $1.2T of T-Bill issuance needed by then
OCTOBER
▪️1: Student Loan payments due (unless taking 1 extra year interest accrues)
▪️6: Employment report
▪️9-15: IMF World Bank meeting
▪️12: US CPI
▪️27: US PCE
NOVEMBER
▪️1: FOMC
▪️3: Employment report
▪️14: US CPI
▪️30: US PCE
U.S Macro data
As expected, the Fed left its short-term lending benchmark at a target range of 5.25% to 5.50%, the level set at the previous meeting in July, and its updated Summary of Economic Predictions continued to show one more rate hike in 2023. However, policymakers surprised markets with an outlook for rates in 2024 that was notably higher than expected, and their rate prediction for 2025 also increased. In addition, the central bank raised its growth forecast, an acknowledgment that the economy has been more resilient than expected.
Perhaps the key focus area for investors from last week's Fed meeting was the update to the "dot plot," or the FOMC's best estimate of where it sees the path of interest rates going. The median dot for 2023 remained at 5.6%, which implies perhaps one more rate hike is on the table, while the rest of the dots for 2024 - 2026 all shifted higher. The Fed pulled back its estimate of rate cuts in 2024 from 100 basis points (1.0%) of cuts to just 50 basis points, although cuts in 2025 are still expected to be 120 basis points, followed by another 100 basis points in 2026, bringing the fed funds rate to under 3.0%.


The Fed's updated set of projections also gave us its latest take on economic growth and the labor market, both of which were more optimistic than the June reading. This makes sense, given that the economy has held up much better than expectations more recently. However, the Fed's view of 2024 growth shows only modest cooling, to 1.5% annual growth, before rebounding to 1.8% in 2025. It also now sees the unemployment rate staying at 3.8% this year, and going no higher than 4.1% for the cycle, well below the 10-year average of 5.0% unemployment.

However, we find severe divergences from the Fed itself. The Atlanta Fed estimates this quarter's GDP at 4.9%, and the St. Louis Fed estimates that the US economy is currently in recession. Which one should we trust?

The prospect of the Fed keeping short-term rates higher for longer along with healthy economic growth signals helped send longer-term U.S. Treasury yields higher, with the benchmark 10-year U.S. Treasury yield reaching a 16-year high. (Bond prices and yields move in opposite directions.)


Historical Fed pauses last about 5-6 months. If July was the last Fed hike, the first rate cut might happen already in Q1 2024.

In our opinion, the Fed is playing with fire here. Monetary policy is the tightest it has ever been, if this continues, something is going to break irremediably.
Weekly initial jobless claims came in lower than predicted and fell to the lowest level since February, further reinforcing views that the labor market remains strong.

Last week we also navigated a potential government shutdown and ongoing UAW strikes. Previous government shutdowns haven't hurt Wall Street severely, but a prolonged one could potentially bite into Q4 economic growth. So could the United Auto Workers (UAW) strike, which has potential side effects on auto industry suppliers. For instance, U.S. Steel (X) plans to idle an Illinois blast furnace and temporarily lay off of hundreds of employees, citing the strike, according to the Chicago Tribune.
We are seeing the most strikes since the beginning of the 21st century. Unionized workers are demanding, and often winning, higher wages.

Macro-OIL
The rally in oil prices has been relentless. We’re seen Brent Crude march upwards crossing $95/bbl and WTI Crude crossing $91/bbl. What’s more is that we seem to be chopping in this higher range now with no real catalyst to support easing at the moment. Goldman Sachs and JP Morgan both have $100/bbl for Brent Crude on the cards.

We have the obvious announcements from Saudi Arabia and Russia extending their production cuts by a total of 1.3 million barrels per day until December. This is definitely weighing on crude oil prices as a whole but, there’s more under the hood.
Refining capacity is now being pushed to the limit. According to Morgan Stanley, “In July, refinery runs reached an estimated 83.2 mb/d, up 2.5 mb/d year on year and also close to a seasonal record.” But, global refining capacity remains constrained and stretched to seasonal highs. A hotter summer hasn’t helped either because distillates need lower ambient temperatures to cool down.

Demand and supply conditions are imbalanced and we’re likely to see deficits continue through to next year. In 2022, the US Government SPR released almost a million barrels of oil into the system to push down prices but that's no longer the case.
OPEC is unlikely to push their cuts much further. They already have almost 5 million barrels per day in spare capacity at the moment. Pushing oil prices past $100 is likely to create adjustments to demand. This means that with higher rates and the global anticipated economic slowdown, volumes will decline even further and that eventually leads to lower revenues for the likes of Saudi Arabia even if prices remain at $100/bbl. This is obviously not what they are hoping to achieve.

Eurozone macro data
Eurozone government bond yields increased after European Central Bank (ECB) officials said another interest rate increase could not be ruled out and after the Fed indicated that rates are likely to remain higher for longer.

The Swiss National Bank (SNB) defied expectations and kept its key interest rate at 1.75%, the first time it has not hiked since March 2022. The SNB said that more increases are still possible if it becomes clear they are necessary to maintain price stability over the medium term. As expected, Sweden’s Riksbank raised its policy rate by a quarter of a percentage point to 4.00% and kept the door open for another increase in November.
Eurozone orders dropped the most in almost three years, causing private sector output to contract for a fourth consecutive month, purchasing manager surveys compiled by S&P Global showed.

The seasonally adjusted HCOB Flash Eurozone Composite PMI Output Index, which combines activity in the manufacturing and services sectors, was 47.1 in September, up marginally from 46.7 in August. (A reading below 50 indicates contraction.) Manufacturing continued to shrink the most, while services sector activity decreased for a second month running.

UK macro data
The BoE’s Monetary Policy Committee voted 5-4 to keep the key interest rate unchanged at 5.25% as economic growth slows, the first pause since December 2021. BoE Governor Andrew Bailey stressed that borrowing costs could rise again if there is evidence of more persistent inflationary pressures.


The decision to halt policy tightening came a day after official data showed that annual inflation in the UK slowed to 6.7% in August from 6.8% in July. Measures of underlying inflationary pressures also declined but remained well above the BoE’s 2% target.
Japan macro data
The Bank of Japan (BoJ) matched expectations of no change to its monetary policy, dashing hopes that the central bank would hint at an exit from negative interest rates. Continued monetary policy divergence between the hawkish Fed and the dovish BoJ weighed on the yen, which weakened to around JPY 148.3 against the U.S. dollar, from about JPY 147.8 the previous week.
Finance Minister Shunichi Suzuki said that the government will respond to excessive currency volatility without ruling out any options. In his view, the operations last year to buy yen and sell the U.S. dollar had been effective, to a certain degree.

The BoJ kept its short-term interest rate at -0.1% and that of 10-year Japanese government bond (JGB) yields at around zero percent. It also left unchanged its 50-basis-point allowance band set on either side of the zero percent yield target, as well as sticking to the 1% cap it effectively adopted in July when it tweaked its policy of yield curve control (YCC) to allow yields to rise more freely. The yield on the 10-year JGB trended upward over the week to 0.74% from 0.70%.

The BoJ maintained its pledge to add stimulus without hesitation if needed. It is continuing with monetary easing under the current framework because sustainable and stable inflation, accompanied by wage growth, is not yet in sight. When the central bank is in a position to achieve this goal, it will consider scrapping its YCC policy and modifying the negative interest rate, according to Governor Kazuo Ueda.
Japan’s core consumer price index (CPI) rose 3.1% year on year in August, slightly ahead of consensus expectations. Core inflation has continued to slow, however, mainly because of the government’s economic measures pushing down energy prices.

China macro data
No major indicators were released in China during the week. However, official data for August released the prior week provided evidence of economic stabilization in the country. Industrial production, retail sales, and lending activity rose more than forecast last month from a year earlier, although fixed-asset investment grew less than expected as the drop in property investment worsened.

On Thursday, China's cabinet, the State Council, pledged to accelerate measures to consolidate the country’s recovery and continue supporting growth in 2024, state media reported. Senior officials acknowledged that while China faces economic challenges, historical trends suggest that the economy is set to improve over the long term.
In a sign of investors’ concern about the health of China’s economy, China recorded capital outflows of USD 49 billion in August, the largest since December 2015, which pushed the yuan to a 16-year low against the U.S. dollar, according to Bloomberg. In response to the deteriorating growth signals, Beijing issued a flurry of pro-growth measures in recent weeks aimed at stimulating consumption and reviving the moribund property market.

Bonus Macro Data:
Evidence of U.S. consumer and business deterioration.
Total household debt in the US is at a record-high of $17.06 trillion.

Net savings are down for the second time in history, at levels not seen since 2009. While this is nominal, it's still down for the only time in history besides the GFC.

Net savings relative to national income are at the second lowest levels in history, surpassed only by what was seen in 2009.

Delinquency rates on Credit Card Loans are at 10-year highs. While being historically low, they're moving higher aggressively.

The YOY change in delinquency rates is higher than ever before, above those that have previously marked recession.

Delinquency rates on loans made by small banks are at all-time highs. The consumer in need of loans from small banks are already in worse shape, and now they're defaulting like never before.

Net private savings for domestic businesses are at extreme all-time lows, below any previous levels.

Personal savings as a percentage of disposable personal income are near all time lows.

The YOY change in federal tax receipts is heavily negative, which indicates less after-tax disposable income for the consumer, as well as almost always a recession.

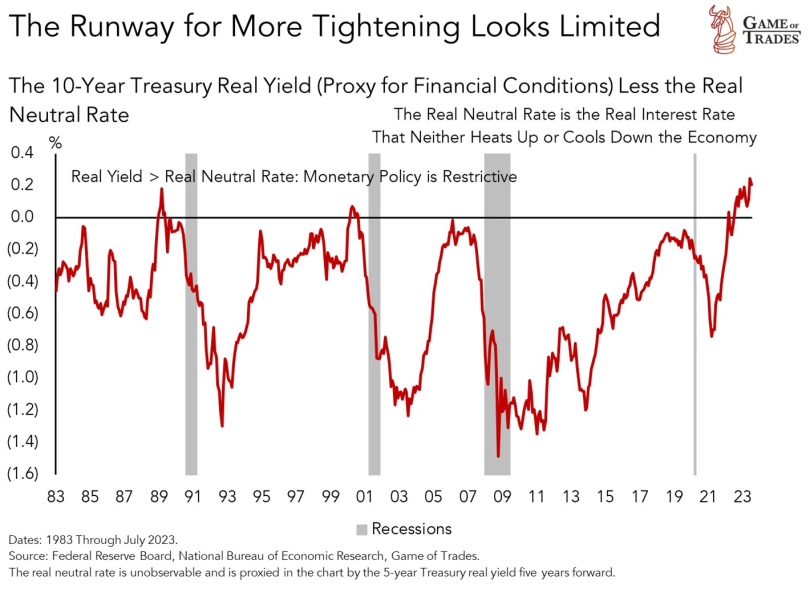
We are facing the longest ever yield curve inversion: the 10-Year minus the 3-Month Treasury Yield curve has been inverted for 216 trading days, the longest period of time in history.

Recent increases in interest rates are likely a temporary phase rather than a return to a "normalization" of higher rates from the late 20th century. The rise has been driven by Central Banks' policy-driven actions rather than fundamental inflationary pressures.
Growing risk of refinancing, especially in the high-yield sector as higher risk-free rates can lead to unaffordable refinancing rates for private sector borrowers, is key. The market seems incapable of digesting the financial vulnerability of companies like Verizon with large debts due, suggesting a crisis if interest rates remain high. Like 2005, the risks of fallen angels is key.
The Fed is playing with fire here.Monetary policy is the tightest it has ever been and if this continues, something is bound to break.


August adds 57 more US corporate bankruptcies. So far in 2023, the number of bankruptcies (459) tops the prior two years, and we have four months left to go.

The Conference Board’s US Leading Index has seen a 17-month consecutive decline, a pattern not observed since the Global Financial Crisis.

Crypto News
=> The SEC failed on Monday to convince a federal magistrate judge to immediately let officials delve into Binance.US’s software, a setback for the Wall Street regulator in its case against the crypto-trading platform.
The SEC says that it has been struggling to get information from Binance.US since it sued the American exchange, along with its international affiliate Binance Holdings Ltd. and its Chief Executive Officer Changpeng Zhao in June.
The SEC alleged in June that Binance and Binance.US, which has been billed as a separate entity intended to serve American clients, weren’t actually independent and broke multiple American securities rules. The regulator more recently has argued that Binance.US’s technology should be inspected to better understand possible links to the global exchange.
Trading volume on Binance.US is evaporating as the cryptocurrency exchange’s fight with US regulators intensifies. After the SEC complaint was filed in June, Binance.US lost its banking support, suspended US dollar deposits, and began a series of layoffs. Former Binance.US Chief Executive Officer Brian Shroder departed last week, when the company laid off a third of its remaining workforce.
=> The SEC isn’t done chasing down crypto exchanges and decentralized finance (DeFi) projects it sees as violating securities laws in the same vein as Coinbase Inc. (COIN) and Binance, said David Hirsch, head of the agency’s Crypto Assets and Cyber Unit.
=> Mt. Gox trustee Nobuaki Kobayashi has officially changed the deadline for paying back the exchange’s creditors from Oct. 31, 2023, to Oct. 31, 2024.
Mt. Gox was one of the earliest cryptocurrency exchanges, once facilitating more than 70% of all trades made within the blockchain ecosystem. Following a major hack in 2011, the site subsequently collapsed in 2014 due to alleged insolvency; the fallout affected about 24,000 creditors and resulted in the loss of 850,000 BTC.
=> Cryptocurrency exchange Binance and Ceffu responded to the Securities and Exchange Commission’s accusation that the wallet provider was related to Binance. Both parties have denied the allegation leveled against them.
=> Coinbase has urged for crypto reform with the launch of its new advocacy campaign, ‘Stand with Crypto.’ The campaign aims to advocate for favorable regulations surrounding cryptocurrencies in the US.
=> Coinbase had explored the acquisition of FTX’s European entity as it planned to increase its foothold in the derivatives business. The plan highlighted the exchange’s push into the derivatives space.
=> Coinbase`s security team has flagged the risk of a 51% attack on Zcash after discovering that a single mining pool, ViaBTC, controls almost 54% of the network’s hash rate. The disclosure has sent alarm bells ringing in the crypto community.
=> Bitcoin mining rig maker Bitmain has committed a substantial investment of $54 million in Core Scientific, a Bitcoin mining firm based in Texas. Core Scientific had filed for Chapter 11 bankruptcy in December 2022.
=> Tether announced the resumption of USDT loans to clients. The announcement came less than a year after the firm halted issuing loans. The company also reported an increase in USDT-denominated loans in its latest financial update.
Staying with Tether, the company has also announced an investment of $420 million to purchase thousands of GPUs for a German crypto mining company through an Irish shell firm.
=> Bankrupt crypto exchange FTX has initiated legal action against the parents of co-founder Sam Bankman-Fried. The exchange alleged that they misused company funds for personal gains, with FTX CEO John Jay Ray III stating they treated FTX like a family business.
=> eToro has received the go-ahead from the CySEC (Cyprus Securities and Exchange Commission) for its CASP (Crypto Asset Service Provider) registration. The registration means eToro is 100% ready for when MiCA kicks in next year.
=> Anatoly Yakovenko, the co-founder of Solana, has urged Congress to end regulatory uncertainty and draft clear regulations around crypto. Yakovenko stated that regulatory uncertainty stifles innovation and drives talent away from the US.
=> Blockchain oracle network Chainlink has tapped into Ethereum layer-2 scaling protocol Arbitrum to drive cross-chain decentralized application development. The two protocols announced the mainnet launch of the Chainlink Cross-Chain Interoperability Protocol (CCIP) on Arbitrum One on Sept. 21, giving developers access to Chainlink’s solution, which taps into Arbitrum’s high-throughput, low-cost scaling.
The combination of CCIP and Arbitrum One’s ecosystem aims to unlock a myriad of use cases, including cross-chain tokenization and collateralization, blockchain gaming, data storage and computation.
=> PayPal announced that Venmo users will be able to purchase the payments giant’s dollar-pegged Ethereum-based stablecoin PYUSD “in the coming weeks.”
Cryptos: spot, derivatives and “on chain” metrics
Digital assets tentatively sold off this week in response to the Federal Reserve indicating another rate hike may come this year, despite deciding to keep interest rates steady on Wednesday.
The business week started somewhat sluggishly as Bitcoin kept the previous weekend’s momentum going and had stalled at around $26,500. However, the bulls came out to play late on Monday when they pushed the cryptocurrency to just over $27,400. After an immediate retracement, bitcoin went on the offensive once more on Tuesday, tapping a 20-day peak at just over $27,500. Nevertheless, the asset failed to maintain its run and started gradually declining in value. A more serious price drop came on Thursday when BTC slumped to a three-day low of $26,400.
Ethereum, the second crypto in command has been on a steady downtrend for several weeks. It was only a matter of time before it lost the hard-gained $1,6k level. September has been the weakest month for Ethereum’s on-chain activity this year.
According to Ultra Sound Money, more than 13,000 ETH ($21M) was added to Ether’s supply since the month began, meaning Ethereum’s burn mechanism failed to offset new ETH entering supply as rewards for validators amid the slump in activity. The low activity has been attributed to the prolonged downturn in the NFT market and the buzz surrounding memecoins dying down.
However, the retracement in on-chain also coincides with Layer 2 transaction throughput setting new highs multiple times in recent weeks. Ethereum’s L2 ecosystem processed an average of 64.2 transactions per second (TPS) on Sept. 14, compared to 12.4 TPS on the Ethereum mainnet.
Chainlink’s native token is the best performer in terms of weekly gains from the top 100 alts with a 15% surge. It’s followed by IMX (13%), CRV (9%), and LUNC (6.5%).
Market Cap: $1.09B | BTC Dominance: 48.5%
Gainers / Losers last 7 days, block size volume.

Bitcoin
Key week for risk assets due to the FED meeting and Bitcoin again without significant movements both upwards and downwards. There are two opposing readings, strength and de-correlation of risk assets or total loss of interest of the participants on the king of cryptocurrencies.
In terms of dynamics, few changes compared to last week, the market continues to defend itself from further declines below the VWAP anchored at the lows of the bullish trend that was born at the end of March. As can be seen, this minor value area (blue) has attempted two upside imbalances without much success. The $26000 level is seen as a minor buying control zone, if lost, it would open the door to further declines and a change of scenarios in major price dynamics.
We continue to insist that in order to propose long scenarios, Bitcoin must recover and conquer the High Volume Node (HVN) of $28100, coinciding in turn with the VWAP anchored at local highs. Once this zone is conquered, the attack on the sell initiative zone should begin, which we will discuss in detail in shorter-term charts.
Bitcoin 18/09/23 30 min chart

Bitcoin 25/09/23 30 min chart

In the following low time frame charts we can see perfectly how the demand is not managing to unbalance to the upside, there are already two unsuccessful attempts. The market must not lose the $26000 level, the buyer control zone of all this minor value area, losing this buyer control would open a window of opportunity for the bears. On the other hand, a coherent long scenario would pass through 3 requisite, effective imbalance to the upside, conquest of the $28100 and neutralization of the sell-side initiative zone, which has been configured as a strong resistance recently.
Bitcoin 18/09/23 30 min chart. Small picture

Bitcoin 25/09/23 30 min chart. Small picture

Moving up in time is where we are aware of the key moment in which we are immersed. The large lower value area that started after the sharp falls of FTX, has attempted a first failed imbalance (JAC + BUEC), resulting in a failed bullish continuation. Generally we like to see clean and vigorous imbalances, quickly moving away from the main value area. However, two-legged imbalances are common, although they always carry some danger due to the implied weakness left by their price dynamics.
Any re-entry into the lower value area could put the bears in control, spoiling any long approach. Bulls should avoid washing out the lows of the buec, leaving a lower low and preventing a visit to the inside of the range. It is undoubtedly a key moment for Bitcoin, as the resolution of these commented dynamics will set the tone for the future of the crypto market in weight towards the end of the year.
Bitcoin 18/09/23 4h chart

Bitcoin 25/09/23 4h chart

Ethereum
After crashing back into the Vwap anchored at all time highs, the market has returned with vigor to the demand zone between $1700 and $1500. After the sharp BTC sell-off one month ago, the market reaction in the demand area has been quite poor. This zone is key, as the loss of this zone would mean that sellers are back in control.
Ethereum 18/09/23 4h chart

Ethereum 25/09/23 4h chart

BNB
We will closely monitor the evolution of BNB as a measure of risk perception. BNB is the cryptocurrency coin that powers the BNB Chain ecosystem. BNB is one of the world's most popular utility tokens and it is used primarily to pay transaction and trading fees on the Binance exchange. It is Binance's flagship token.
At first glance we note that the Vwap anchored at highs has never been exceeded or practically tested since late 2021. The vigorousness with which the Vwap anchored at the local lows of June 2022 has been broken through makes us aware of the major weakness on this token.
Clearly, the area to watch is the historical support at $220 and we are already in this area with little reaction, from there Binance could start to have problems. We believe it is very necessary to follow very closely the evolution of this token, as it could anticipate a new CEX crisis.
BNB 18/09/23 4h chart

BNB 25/09/23 4h chart

Classic markets
The primary reaction in markets after the Fed meeting has been an outsized move higher in Treasury yields and a swift move lower in stocks. With both the 2-year and 10-year U.S. Treasury yields hitting highs of this cycle after the Fed meeting, longer-duration parts of both fixed-income and equity markets have been the laggards in recent days. Historically, a rapid rise in yields has weighed particularly on higher valuation growth parts of the market, and this could continue in the near term.
For equities, the higher yields also come at a time when there was some concern around extreme valuations, particularly in the large-cap technology space and among the "Magnificent 7" (Magnificent 7 stocks include AAPL, AMZN, GOOGL, META, MSFT, NVDA, TSLA). Investor enthusiasm around artificial intelligence (AI) initially drove these stocks higher, but valuations are what they are, a clear excess of the market, and now they face the challenge of a higher-rate environment. In addition, markets have walls of worry to climb around a potential government shutdown and ongoing UAW strikes, which may create near-term uncertainty as well.
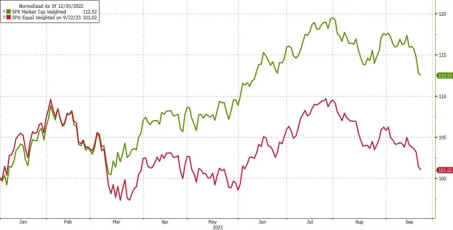
It's a positive year for the stock market so far, but it's hardly one for the ages. If we index the SP 500 from the October 2022 low, we can see how muted this bull market has been.

But…. in nearly seven decades there has never been a post-inversion equity rally that was not completely reversed going into subsequent recessions/bear markets.

Equal-weighted SP back to flat on the year.
Tech relative to small caps has just crossed the levels seen during the Dot Com bubble’s peak.

Only 35% of the S&P 500 has managed to outshine the index itself, marking one of the lowest percentages we've witnessed in the past decade.

Last week brought us the largest outflow from US equities since December of 2022. Not forgetting that last week's inflows were considerable.

Fascinating to see the strong positive correlation and recent massive divergence between US job openings m/m and the SP 500.

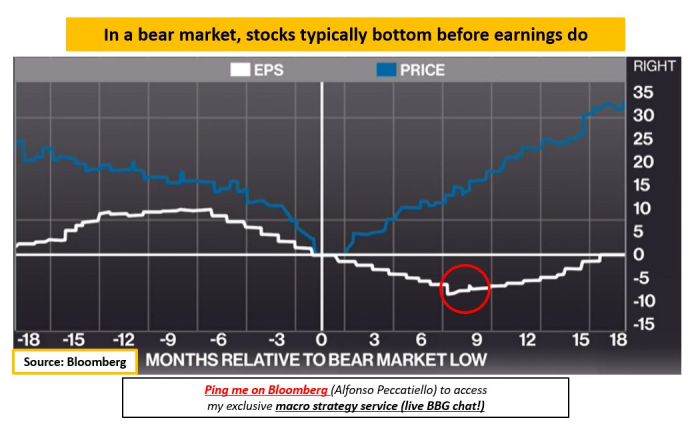
History shows the stock market (blue) tends to bottom about 8-10 months before earnings do (white). If the stock market bottomed in October 2022, earnings growth should turn positive from here. This is what analysts expect and you?
Earnings and fundamentals could face headwinds as interest rates gradually feed into companies’ financial statements via higher financing costs.


Here’s an interesting historical perspective on the combined yield for a 60/40 portfolio (using 10-year bond yields on the 40% side and cyclically adjusted earnings yield on the 60% side), in hindsight, it was always going to be a struggle for 60/40 returns coming from a record low like that. And even after a significant adjustment, it still doesn’t look great.

Cumulative short flows across US equities hit a new year-to-date high last week, according to Goldman.


Fundamental hedge funds just added the most short single stock exposure since March of 2020.

CTA's BofA:
SP500 longs could see massive selling by CTA's at 4176.

CTA´s McElligott, Nomura:

Goldman Sachs Desk:
Looking at the metrics, broader measures of SPX gamma exposure paint a similar, perhaps even more dramatic picture: there is -$1.3bn of short gamma in the entire U.S. equity market. Lately, over the past year or so, the days on which negative gamma appears have marked local lows.

However, a larger trend may be prevailing. When we have seen the longer moving averages of gamma exposure turn, they have marked turning points in the market. Perhaps this could be related to the fact that the options market has a greater effect on overall trading volumes with the increase in more products, expirations, strikes, etc.....

Goldman Sachs: The CTA community is currently long $33b S&P (84th percentile historical rank RE length). In a flat tape over the next 5 sessions, we estimate -$4b of S&P supply (-$10b over the next month). In a down 2.5 SD tape, this supply grows to -$20b over the next week (and -$68b over the next month).
Short term: 4,469
Medium term: 4,348
Long term: 4,299

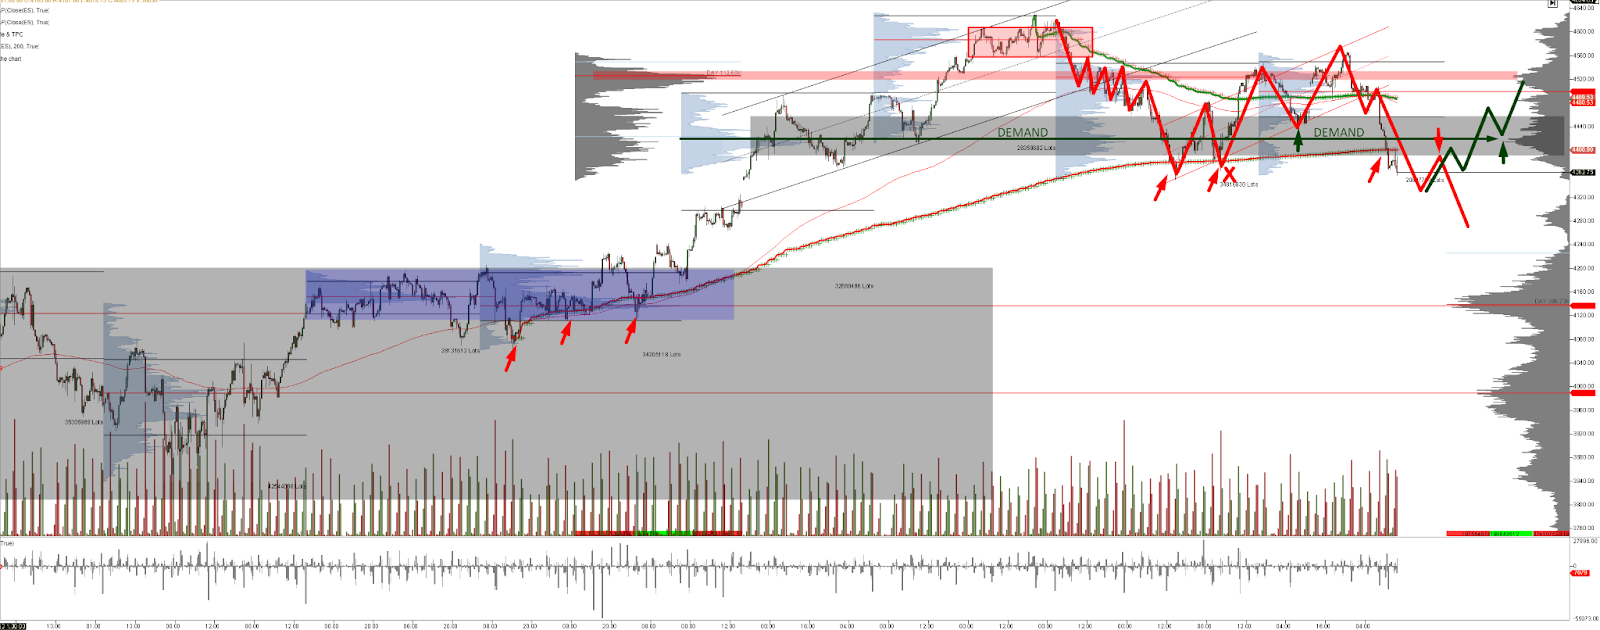
Before the vacation break of the editor of this newsletter, the need for demand to stay above the June VPOC and the red VWAP was proposed as key. Such a defense by buyers was given during the last month, however in a very poor manner and clearly leaving a corrective rather than impulsive pattern during the last month's rally. As they say, risk happens slowly and then suddenly it happens all at once. The market, in a state of over excitement and with metrics reminiscent of 2000, has gone into a tailspin listening to and shuddering at the "higher for longer" inflicted last week by the Fed.
We are dangerously close to the sell trigger zone (4350-4300) of the systematic strategies. Let us not forget that these strategies, which do not respond to macro or fundamental criteria, have been the main source of market demand for almost this past year. It appears that the market's favorite "crunch vol" trade may no longer work, causing many market participants to receive an accelerated and painful lesson in macroeconomics.
In terms of price dynamics, if the market does not manage to recover the June VPOC, a clear buying trench in recent months, it seems inevitable that the market will look for the price congestion zone it built up between April and May of this year.
28/08/23 SP500 4h chart. Big picture

18/09/23 SP500 4h chart. Big picture

25/09/23 SP500 4h chart. Big picture
18/09/23 SP500 futures small picture

25/09/23 SP500 futures small picture

As we indicated in the previous newsletter, the market had before OPEX its opportunity to progress upwards, supported by a positive Gamma market, where the Market Makers bring liquidity to the market, buying the dips and selling the tops. This positive Gamma regime reduces volatility significantly, allowing the massive inflows of Vol Control Funds to enter the market. These flows have generated a "snowball" effect throughout this year, where many active human managers have been forced to enter the market due to the risk of fear of missing out (fomo).
Systematic flows and their "snowballing" influence on the market have created a synthetic situation in which it seems that risk does not exist, to the extent that childish and stupid narratives such as "softlanding" or the "new AI Bull market" have found justification among the majority of market participants. It is nothing new that price is always the element that generates the most excitement and can even hide realities.
The volatility crunch perpetrated by systematic flows and option-derived flow seems to have its days numbered. The unwind of these positions is a risk in itself for the market, which arrives with its tongue hanging out, with many metrics for the history and justifying narratives completely disconnected from reality.
The gamma profile is representative of how much market sentiment has changed. Note the notional gamma accumulated in lower strikes relative to the last gamma profile published in last week's newsletter. It is important to monitor now the possible monetization of puts on those relevant strikes either by take profit or by a general relaxation of the post-Fed sentiment. Again, in the short to medium term, we do not see strong enough catalysts to trigger a market reversal. Interest rates don't matter until they matter and everything seems to indicate that the market is going to start doing the dirty work that central banks don't want to do, lowering inflation by eroding risk assets.
Gamma Profile 18/09/23

Gamma Profile 25/09/23

Implied SPX dealer gamma imploded to a multi-year low today, and that is a not minor reason for concern.

The market is in wild negative gamma exposure and getting dangerously close to the long-term triggers of systematic flows. If you think the market is oversold, just wait for those trigger levels to break. At the same time, although the gamma exposure is huge, the skew does not seem to indicate that we have reached a panic zone and possible reversal, you still have a lot of room to run.
Now think, what short to medium term catalysts could trigger a change in market bias? The FED's thump on the table last week has turned the tide, and as Warren Buffet would say, it is now where you can see who is swimming naked.

Passive management and the systematic flows of active management, combined with the market's favorite derivative instrument, are capable of generating this type of distortions in the short to medium term, but the macro cannot be neutralized or wiped off the map. The real economy has its times and although these flows can slightly delay the appearance of symptoms, they cannot prevent the patient from falling ill sooner or later.


