.png)


.png)
We have a very busy week ahead of us, with plenty of potential volatility catalysts, from consequential economic data like CPI, a dozen Fed speaker appearances and Q3 earnings season kicking into full gear on lucky Friday the 13th. We also will be parsing how the markets react to increasing geopolitical tensions in the middle east after this weekend's heartbreaking and tragic events.
A Consumer Price Index report (CPI) scheduled to be released on Thursday will show whether the recently mixed trends on the path of inflation extended into September. The most recent CPI report for August showed that inflation rose 0.6% on a month-to-month basis. Higher energy prices fueled much of the increase; excluding energy and food prices, core inflation rose at a more modest 0.3%.
Expectations are low heading into earnings season, which opens late this week as major banks begin reporting third-quarter results. As of Friday, analysts surveyed by FactSet were expecting companies in the SP 500 to post an average earnings decrease of 0.3% compared with the same period a year earlier. If there is a decline, it would be the fourth consecutive quarter of shrinking earnings.
The U.S. labor market’s resilience continued to dampen the near-term prospects of a recession, as the gain of 336,000 jobs in September was the biggest in eight months and roughly double the number that most economists had been expecting. Friday’s strong jobs report helped to accelerate the recent price sell-off in the bond market, as the 10-year U.S. Treasury’s yield climbed to the highest level since 2007. It closed around 4.79% on Friday, up from 3.30% just six months earlier. Prospects of lower global demand for petroleum weighed on oil prices, and U.S. crude dropped to around $83 per barrel for a nearly 9% weekly decline, the biggest since March 2023.
The major indexes closed mixed over another week of top-heavy trading in which large-cap growth stocks and the mega-cap information technology and internet stocks, in particular, widely outpaced the rest of the market. The SP500 managed to snap a string of four negative weeks in a row, posting a fractional gain, while the Nasdaq rose nearly 2%. Reflecting the underperformance of most stocks, an equally weighted version of the SP500 Index lagged its market-weighted counterpart by the largest margin since March. Similarly, large-cap growth stocks outperformed their value counterparts (according to Russell indexes) and the large-cap SP500 outperformed the small-cap Russell 2000 Index by the widest margins over the same period.
Bitcoin (BTC) was able to rise above $28,400 for the first time in several weeks, currently having an increase of 2.6% over the last seven days. However, most other top altcoins including Ethereum (ETH) and Binance Coin (BNB), have plummeted by at least 1.5% since last week. Moreover, the week was filled, as usual, with several stories related to high-profile lawsuits, including the one against the founder of FTX.
Macro y news
Economic Calendar:

Upcoming relevant events:
OCTOBER
▪️9-15: IMF World Bank meeting
▪️12: US CPI
▪️27: US PCE
NOVEMBER
▪️1: FOMC
▪️3: Employment report
▪️14: US CPI
▪️30: US PCE
U.S Macro data
September's jobs report released last week showed that the labor market is not giving up without a fight. The Labor Department reported that employers added 336,000 nonfarm jobs in September, roughly double consensus estimates. However, the details in the jobs report offered a more nuanced picture. Average hourly earnings rose 0.2% in the month, bringing down the year-over-year gain to 4.2%, its lowest level since June 2021. The workforce participation rate also stayed steady at 62.8%, its best level since the eve of the pandemic lockdowns in February 2020. Taken together, the data suggested that increasing supply instead of rampant demand for workers was driving the labor market, making for a more benign inflationary environment.


There were a couple of narratives being discussed:
- Wages didn’t go up and that will mean lower inflation so the Fed won’t have to hike in November. This is odd because the probability of a hike actually increased from the previous week.

- The bond market reacted negatively and so did equities at first. We think the bond market is right to price in higher rates and uncertainty. In fact, if anything this employment report brought a lot of uncertainty to the current situation.
- A soft landing narrative is being discussed as full employment persists while inflation continues to decline. The problem with this scenario is that with full employment, the economy is likely to overheat and push inflation right back up. Fed Chair Powell has mentioned several times that the economy needs below-trend growth and a softening in the labor market in order to achieve the inflation target level of 2%.
On Wednesday, payrolls processor ADP also offered a much different picture of the job market, with its tally of private sector payrolls only expanding by 89,000 in September, the smallest increase since January 2021.

US gasoline demand tumbled last week, sending inventories sharply higher. Slowing economic growth?

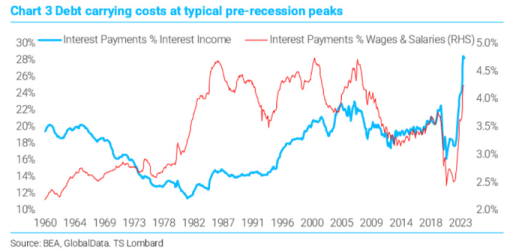
A drop in credit card spending is raising concerns about the financial health of the US consumer and the outlook for holiday sales as cardholders face record-high interest charges. The fall in card spending comes as consumers’ finances are being strained by both higher interest rates and debt loads, particularly when it comes to borrowing on credit cards. This debt has been rising in the past year and recently topped $1tn for all Americans for the first time.
On Friday, the Federal Reserve reported that the average annual interest rate that consumers are paying on credit card balances hit a record high of 22.8 per cent at the end of August, up from 16.3 per cent a year ago. As a result, US consumers are in line to pay as much as $40bn more on interest payments in the next year on their credit card balances than they were a year ago, according to WalletHub, which tracks credit cards and consumer finances.

Credit Card Delinquency rates at small banks have reached 7.51%, the highest level ever recorded.

US multi-family housing loan delinquency rates continue to rise and affordability index is at new record lows.


The number of banks tightening lending standards has reached one of the highest levels in the last 35 years and has usually foreshadowed a recession.
Some charts speak for themselves. What you're viewing highlights the percentage of banks tightening lending standards for large and middle-market corporates. Over half of domestic banks are now enforcing stricter lending rules. We're nearing levels reminiscent of the 1990s and the Dotcom recession, though we're some distance from the peaks of the GFC. Clearly, tighter regulations played a significant role in lending shifts during the GFC.
The tight labor picture and ensuing wage pressures negatively impact business profitability, especially for smaller entities. Those businesses requiring capital for survival are either grappling with elevated capital costs or, as lending standards tighten, find themselves excluded from capital access altogether.


US small business defaults are accelerating.

Eurozone macro data
After a volatile week in European bond markets, the yield on Germany’s 10-year government bond slipped back below 3% but remained near a decade-plus high. French and Italian bond yields ticked up amid cautious sentiment. Economic data signal the eurozone economy struggled in the third quarter.
Both official and private-sector data suggested that the eurozone economy likely stumbled in the third quarter. The final Composite Purchasing Managers’ Index (PMI) compiled by S&P Global came in at 47.2 in September, marking a fourth consecutive monthly contraction. (PMI readings less than 50 correspond with shrinking business output.)

The EU’s statistics office reported that eurozone retail sales fell more than expected in August, declining 1.2% sequentially due to a sharp drop in gasoline, mail orders, and internet shopping.

On a month-over-month basis, German industrial orders in August bounced back by a seasonally and calendar-adjusted 3.9%, after dropping 11.7% in July. Strong increases in computing, electronic, and optical products drove the gain. Meanwhile, exports fell 1.2% sequentially in August, substantially more than forecast, following a 1.9% decline the previous month due to weak global demand.

UK macro data
House prices in the UK fell for the sixth month running in September, easing 0.4% sequentially, mortgage lender Halifax said. Another mortgage lender, Nationwide Building Society, estimated that house prices were unchanged last month after a 0.8% reduction in August. Both indexes declined the most year over year since 2009.

Meanwhile, a rapid slide in homebuilding caused activity in the construction industry to fall at the fastest pace in more than three years in September, an S&P Global/CIPS survey of construction purchasing managers showed.
Japan macro data
Stocks in Japan fell over the week, with the Nikkei 225 Index down 2.7% and the broader Topix Index declining 2.6%. Equities came under pressure amid surging U.S. bond yields and concerns that central banks will remain hawkish for longer. In Japan, economic data releases showed that real wages and consumer spending continued to fall in August, also weighing on sentiment.
Speculation was rife that Japan’s Ministry of Finance (MoF) had intervened in the foreign exchange market to stem the yen’s slide, following the currency’s near-instant surge after it briefly breached the JPY 150 against the U.S. dollar level, which many market participants had anticipated could serve as a trigger for authorities to step in.
MoF officials neither confirmed nor denied whether they had intervened after the yen plunged to its lowest level in 11 months, but they continued to stress that they would act against excess volatility without ruling out any options. The yen finished the week stronger, hovering around JPY 149 against the U.S. dollar.
The yield on the 10-year Japanese government bond (JGB) rose to 0.80%, a 10-year high, from 0.76% at the end of the previous week. Despite the BoJ making unscheduled purchases of JGBs at maturities between five and 10 years, yields rose amid the sell-off in U.S. Treasuries and increased expectations that the BoJ will pursue monetary policy normalization sooner rather than later.
Why do we care so much about Japan and the BOJ?
They are by far the largest holder of US debt and equities, holding over 1.1 Trillion US dollars worth of debt.

Japan's incredible foreign holdings of US debt is widely regarded as the “spread trade”. The spread trade involves Japanese investors selling their Yen in favor of USD to take advantage of the rate spread. US bonds currently offer far higher rates than Japan.

If the spread trade were to unwind, Japanese holders of US debt would sell their US debt and move back to the Yen, creating a massive outflow from US debt and equities, adding heavy pressure to both markets. If the spread trade collapsed. Spread trade holders would be selling their USD in favor of Yen. This would force more spread traders in the red, causing more currency exchange, and so on. The same would be true for US stocks and bonds, as Japanese holders rush to sell both.

What would cause the spread trade to collapse? A continuous increase in the Japanese Yen, or an increase in Japanese yields could induce a spread trade collapse. We are currently seeing the latter, but only to a small extent.

If the BOJ were to pivot, a spread trade collapse would be near certain. However, they've maintained a dovish policy for 3 decades; why would they pivot now? The answer: Inflation is on multi-decade highs, and they may be forced to.

The Japanese yield curve is the steepest it has ever been. The long end of the Japanese curve indicates higher rates, and the BOJ, like the FED, may be forced by inflation to listen to the bond market and pivot. If the BOJ pivots, the spread between US and Japanese yields may tighten, creating lower demand for US bonds from Japanese investors, thus placing pressure on the spread trade.

There are many factors pointing to a Japanese spread trade change and a BOJ pivot. If either were to happen, there could be a mad rush from the dollar to the yen in a race out of US bond and equity markets from foreign holders.

China macro data
Financial markets in China were closed last week for the Mid-Autumn Festival and National Day holiday and will reopen Monday, October 9.
China’s factory activity returned to expansion for the first time since March, the latest signal that the economy may have bottomed. The official manufacturing PMI rose to an above-consensus 50.2 in September from 49.7 in August. The nonmanufacturing PMI expanded to a better-than-expected 51.7 from 51.0 in August. Separately, the private Caixin/S&P Global survey of manufacturing and services activity both eased from the previous month but remained in expansion.

China’s crisis-hit property sector showed slight improvement in September. New home sales by the country’s top 100 developers fell 29.2% in September from a year earlier, easing from the 33.9% drop in August, according to the China Real Estate Information Corp. The slower month-on-month decline came after Beijing rolled out a raft of stimulus measures targeting the property sector in August.
Crypto News
=> A federal judge rejected the SEC's attempt to recoup its loss against Ripple, stating that the SEC failed to prove its case. The judge set a trial date for April 2024 for the remaining issues, and the SEC may still appeal the overall case later. Previously, the judge ruled that Ripple violated securities laws with institutional investors but not with retail customers, raising questions about crypto regulation.
=> Sam Bankman-Fried's trial for alleged multibillion-dollar fraud began on October 3, 2023, in Manhattan. He's accused of orchestrating FTX's collapse, once valued at $30 billion, leaving customers in distress.
It was revealed that the exchange had a hidden backdoor. This allowed Sam Bankman-Fried's firm, Alameda Research, to maintain a negative balance of up to $65 billion. SBF maintains his innocence, possibly relying on an "advice of counsel" defense. The trial is expected to last up to six weeks, and if convicted on all charges, he could face a maximum of 110 years in prison.
=> Ledger, a hardware crypto wallet maker, is cutting 12% of its workforce, with CEO Pascal Gauthier citing the need for long-term sustainability due to the 2022 bear market and industry challenges. Approximately 88 employees may be affected.
Meanwhile, this follows Ledger's $109 million funding round and integration with PayPal a few months back. Other crypto firms, including Binance.US, Nansen, Coinbase, Huobi, and Crypto.com, have also announced staff reductions due to market uncertainty and regulatory challenges.
=> IMF Proposes Framework to Assess Crypto Risks by Country. EU to Release Plans for Wholesale Digital Euro in Weeks.
=> UAE Dirham Stablecoin DRAM Launches on Uniswap and PancakeSwap.
=> Canada Clarifies Stablecoin Rules for Exchanges and Issuers.
=> Binance to Stop Offering BUSD Lending Services by October 25.
=> Binance Faces Class Action Lawsuit over Alleged Role in FTX Collapse.
=> Kraken to Acquire Dutch Exchange BCM, Expanding in Europe.
=> Ripple Receives Formal Approval for Payments License in Singapore.
=> UBS Launches Pilot of Tokenized Money Market Fund on Ethereum.
=> Pro Crypto Lawmaker Patrick McHenry Assumes Temporary Role as US House Speaker after Kevin McCarthy’s Removal.
=> Bitcoin Comes to Cosmos Network by Nomic
Cryptos: spot, derivatives and “on chain” metrics
It was a week full of headlines in crypto, but they weren't being made by market stalwarts Bitcoin and Ethereum. Their stable values suggest cryptocurrencies are less reactive to the current news cycle than they were during its heady 2021 bull run and subsequent 2022 crash.
Market leader Bitcoin (BTC) grew a modest 2.7% over the seven days and now changes hands at $27,952. It briefly hit a two-month high on Sunday night when it crossed the $28,000 threshold. The closest contender Ethereum (ETH) had a comparably harder week and lost 2.1% to trade at $1,636 at the time of writing. Its weak performance comes despite several positive announcements, including a UBS asset tokenization trial supported by the Monetary Authority of Singapore (MAS) and the launch of nine Ethereum Futures ETFs in the U.S. on Monday.
Only two cryptocurrencies posted any notable price movements, rallying around 15% this week: Avalanche (AVAX), which currently trades for $10.39, and Solana (SOL), which is currently worth $23.31. On Monday, the Solana network's total value locked (TVL) hit a new 2023 high of $338.82 million.
XRP also witnessed an uptick in its valuation, primarily driven by two significant events. Firstly, the US SEC’s unsuccessful bid to appeal in the Ripple case instilled confidence among XRP investors. Secondly, Ripple’s Singapore arm obtaining clearance to extend its payment services in the Asian region further buoyed its associated token, XRP.
The broader crypto regulatory outlook is still marked by uncertainty. The SEC’s proactive stance is evident in their ongoing legal challenges against industry powerhouses Binance and Coinbase. These investigations, targeting pivotal players, underscore the crypto world’s volatile regulatory environment right now and emphasize the pressing need for well-defined frameworks.
Gainers / Losers last 7 days, block size volume.

Bitcoin
In terms of price dynamics, few changes compared to last week, the market continues to defend itself from further declines below the VWAP (white arrows) anchored at the lows of the bullish trend that was born at the end of March. However the minor cumulative structure above this Vwap has left a first bullish continuation failure with re-entry to the value of this minor structure. Demand has reacted at the VPOC minor and seems to be attempting a new imbalance, however we have not yet seen demand strength to break through the $28100 area.
As can be seen, this minor value area has attempted two upside imbalances without much success and now we are on the third attempt. The $26000 level is seen as a minor buying control zone, if lost, it would open the door to further declines and a change of scenarios in major price dynamics.
We continue to insist that in order to propose long scenarios, Bitcoin must recover and conquer the High Volume Node (HVN) of $28100, coinciding in turn with the VWAP anchored at local highs. Once this zone is conquered, the attack on the sell initiative zone should begin, which we will discuss in detail in shorter-term charts.
Bitcoin 02/10/23 30 min chart

Bitcoin 09/10/23 30 min chart

In the following low time frame charts we can see perfectly how the demand was not managing to unbalance to the upside, there are already two unsuccessful attempts. The market is now in the third attempt of imbalance to the upside and it seems that the Vwap anchored at local highs is acting as resistance. We have yet to see a buying initiative that is a true sign of character change.
A coherent long scenario would pass through 3 requisite, effective imbalance to the upside, conquest of the Vwap anchored at local highs and neutralization of the sell-side initiative zone ($30300), which has been configured as a strong resistance recently. On the other hand, the market must not lose the $26000 level, the buyer control zone of all this minor value area, losing this buyer control would open a window of opportunity for the bears.
Bitcoin 02/10/23 30 min chart. Small picture

Bitcoin 09/10/23 30 min chart. Small picture

As the reader knows from these weekly newsletters, the possibility of a credit event is on the table. It is interesting in this case to make a comparison of BTC against the Nasdaq and against the credit spreads (HYGH) which in this case of the following chart is inverted. Every time the credit spreads are tightened BTC corrects and in many occasions makes new lows, it is also remarkable how BTC has not accompanied the powerful rise in the Nasdaq since the beginning of the year. Bitcoin as a monetary phenomenon has decoupled from classic risk assets or will it continue to be vulnerable to stresses in classic markets? we will know soon…

Ethereum
After crashing back into the Vwap anchored at all time highs, the market has returned with vigor to the demand zone between $1700 and $1500. Even with the news of the approval of the ETH futures ETF, the market reaction in the demand area has been quite poor and it's been too many weeks without any reaction from buyers. This zone is key, as the loss of this zone would mean that sellers are back in control.
Consistent long scenarios require seeing price vigorously break out of the demand zone to subsequently conquer the Vwap anchored at all-time highs. The big battle for the bulls lies there, neutralizing that clear selling inciative zone at the Vwap.
Ethereum 02/10/23 4h chart

Ethereum 09/10/23 4h chart

BNB
We will closely monitor the evolution of BNB as a measure of risk perception. BNB is the cryptocurrency coin that powers the BNB Chain ecosystem. BNB is one of the world's most popular utility tokens and it is used primarily to pay transaction and trading fees on the Binance exchange. It is Binance's flagship token.
At first glance we note that the Vwap anchored at highs has never been exceeded or practically tested since late 2021. The vigorousness with which the Vwap anchored at the local lows of June 2022 has been broken through makes us aware of the major weakness on this token.
Clearly, the area to watch is the historical support at $220 and we are already below this level with risk of consolidation and bearish continuations. From there Binance could start to have problems. We believe it is very necessary to follow very closely the evolution of this token, as it could anticipate a new CEX crisis.
BNB 02/10/23 4h chart

BNB 09/10/23 4h chart

Classic markets
We had the first green close in 5 weeks on the S&P 500. The week started out with the usual selling pressure. But, Friday brought us quite the turnaround in equities for US Markets. What’s most surprising is that this massive green Friday came after a big upward surprise in the unemployment numbers, and in the face of bond yields and the US Dollar still remaining elevated.
The most plausible explanation is that the market was oversold and was due for a bounce. And Friday brought with it the weekly options expiries. Given that Monday is Columbus day and the bond market is closed, we may see continuation to the upside in equities barring external factors such as the current geo-political situation in the Middle East escalating further.
The bond market is closed for Columbus Day, a federal holiday, but futures tracking the 10-year Treasury note yield are down from last week. The yield was 4.74% on Monday, according to FactSet, slipping from last week’s levels. At one point last week, the yield hit 4.887%, the highest since August 2007.
Crude oil prices jump 5% after this weekend's events in the Middle East. Oil prices are above $87/barrel after dropping below $82 on Friday.Despite a drop last week, oil prices are rising back toward 52-week highs. Energy resources are now more important than ever.

Earnings Q3-2023
The current earnings estimates seem optimistic. It's likely that we will continue to see downgrades throughout the earnings season. The outlook from the earnings calls this quarter is likely to point towards lower revenues and possible adjustments in pricing downwards in to order for companies to manage the decline in volumes.
While we expect top line revenue will take most of the hit, weaker pricing power and rising financing costs, will lead to lower operating leverage and lower profitability as well. Freight and labor costs were two major issues that had reversed in the previous two quarters and this had now largely normalized and so may not have much of a positive effect any longer.
We will see volumes decline because of overall demand being destroyed caused by the higher level of pricing over the last few quarters. Add to that the pressure of stimulus measures and excess savings declining. The consumer has become weaker and that means more cost conscious spending even on food, grocery and restaurant purchases. Consumer Staples' (XLP) bleeding is a true reflection that something is going on behind the scenes.

America is a consumer nation and when we can't consume then the recession is here. Can we have these elevated P/E's when there isn't spending to support the market?

Q3 2023 earnings season starts this week, ~90% of the SP500 have entered the blackout period as of this weekend. The blackout period is significant because this is the time when companies cannot buyback their stock. But, this period is also known as the quiet period and it’s the time when companies cannot divulge any information surrounding their performance prior to their earnings release. Ideally, volatility should be low during this period but, given how the market dynamics have changed because of options, that may no longer be the case.
According to FactSet, the expected blended earnings growth rates for the upcoming Q3, 2023 results are:
SP500 = -0.39% (Q2 was -4.1%)
Nasdaq 100 = +12.32% (Q2 was +16.23%)
There are a few things to consider this earnings season:
- The decline in inflation will mean companies with pricing power who increased prices will have to reverse the situation, i.e., adjust prices downwards. We’re likely to see revenues decline YoY for most companies not just because of a decline in pricing though, but also because demand has declined.
- While energy costs have increased, we may not readily see the impact this quarter for ex-energy companies. However, one thing to remember is that a spike in oil prices is not always passed on to the consumer. What we saw over the last couple of years was more the effect of the supply chain challenges.
- US Dollar strength however, may have a more immediate impact on revenues and earnings. Trough to peak, the US Dollar Index is up almost 7% in the third quarter.
- Wage costs will be interesting. We’ve seen wage costs increase in certain sectors and some tightness still remains in select sectors. This will be an important component to follow.
- The consumer is weaker. Over the first two quarters, we still had the residual impact of fiscal stimulus in the system with cost of living adjustments, SNAP benefits and stimulus checks. Much of the excess savings from the pandemic period are now gone. I’m sure you’ve seen plenty of charts to attest to that. But, as well there was a ballooning of credit. Unfortunately, we’re seeing the interest burden affect the consumer now and delinquencies are rising rather rapidly, reaching almost pre-pandemic levels.
- Many of the tech companies were quick to cut costs and adjust to the new normal. Whether the cost cutting will be sufficient to sustain profits in the face of lower demand remains to be seen.
Metrics and ratios
The ratio between the Nasdaq 100 and the Dow Industrial average is at levels last seen at the highs in 2021 and 2000.

The ratio between the Nasdaq 100 and the Utilities sector is now above the levels seen at the top in 2021 and nearing those seen at the top in 2000.

The current Nasdaq to Treasuries ratio stands 70% higher than its level during the tech bubble's peak. This chart puts into perspective how, despite ongoing issues with Treasuries, the more relevant question now is whether overall equities can remain as overvalued as they are in today's interest rate environment.

The yield curve is seeing its most aggressive period of steepening since 2000. History says SPX won't hold on too much longer.

This is the 3 month Rolling window correlations between 30y UST yields and SPX, widest by far going back to pre GFC.

Bond volatility has diverged significantly from equity volatility over recent quarters. Are we finally entering the environment necessary for the VIX to catch up?

If October 2022 was the low, that would've been one of the worst equity risk premiums at a market low ever. Now, because rates have moved higher with equity prices, equity risk premium is now at the same level it was at the 2007 high.


The equity market's current resilience in the face of rising bond yields reminds very much of events in 1987, when equity investors' bullishness was eventually crushed.


Positioning
Another week, another dip lower in aggregate positioning. But still far from "must buy" levels.

HF "Net Selling" picked up in the past 5 days.

Asset Managers all in !!

The Goldman "Sentiment & Positioning" indicator is far from screaming buy.

Systematics flows have reduced longs but nothing huge, but still a relatively big "cut" since the most recent highs.

CTA convexity: there is much more to buy in an upside scenario than there is to sell in a down scenario when looking at the 1 month projection. Upside convexity could become "dynamic".

Since positioning was broadly unchanged, vol control funds are still in a vulnerable spot. Even a modest uptick in close-to-close volatility will likely result in some pretty heavy selling flows being triggered, ultimately creating some headwinds for the equity market and some tailwinds for volatility.

From Tier1 Alpha:
We're still not seeing any improvements in our longer-term breadth models, with the 50-day breadth still low in the 3%ile. There have been a lot of claims that when the 50-day breadth is this low, it's generally a good buying opportunity. While that may have been true on some occasions, breadth can also still deteriorate from here. Nothing highlights this more than our 200-day breadth model, which, although low, is still a ways off from being what we would consider extreme.

Currently, around 66% of the S&P 500 is trading below their respective 200-day moving averages, which leaves significant room for the downside. This is an especially important metric to watch because index drawdowns have historically held the closest relationship with 200-day breadth since it tends to filter out a lot of the noise. In other words, it is not quite the bull case some are making it out to be.

Market comment
Following a weak ADP, general expectations were for further weakening in payrolls. The short-term volatility surface had taken on a distinct downward slope (backwardation) suggesting that the jobs report data and weekend "fears" were driving implied volatility higher. And, unfortunately for the bears, and as it happened, elevated implied volatility that fails to materialize is often the catalyst for a rally. With the SP500 near support, we were not surprised by a relief rally on a very strong jobs report, which would again stoke fears of further rate hikes by the Fed.


But leaving aside last Friday's squeeze, nothing has changed in terms of major price dynamics. If the market does not manage to recover the June VPOC, a clear buying trench in recent months, it seems inevitable that the market will look for the price congestion zone it built up between April and May of this year.
Looking at the charts, we clearly see that the market is still below the buy control zone established since last June. As long as the bulls do not manage to regain this control, there is no seasonal pattern or oversold indicator that will work. The market is undoubtedly in a fragile situation not seen this year, this week will be key to know the strength of the bulls and their narratives.
Market's favorite trade: "crunch vol" trade may already have only a small impact as macro is taking control of the market after so many months of total control by the systematic flows, which have come to make the rest of the market participants believe that it is the new start of a bull market with the house literally on fire.
02/10/23 SP500 4h chart. Big picture

09/10/23 SP500 4h chart. Big picture

This key moment forces us to go even further down the timeframe in the charts. This is where we clearly see the defense on the demand side.
The market has defended itself at the gates of the abyss. As we can see in the chart below, an intermediate buyer control and ultimately a minor buyer control has been established. It has been hard to defend itself but it has succeeded, the market after the gamma squeeze on Friday with the unemployment data has taken the bullish path and knowing in advance that the market is dominated by leverage and systematic flows, it will ignore the geopolitical events continuing to rise until the inflation data of this week is known.
However, the final test will be the recovery of the June Vpoc, an area marked in green on the chart. We continue to believe in a break and test on two legs below this control zone with a short squeeze that will last until the inflation data is released, which we expect to come out hot, disappointing the market.

Gamma
We continue to see high notional gamma in lower strikes, despite the squeeze the market does not close these positions. As expected, the call gamma has increased significantly. As always, the change in the market's gamma regime will be key to the future of the market in the coming sessions. Currently the gamma flip is at 4350 points.
Gamma Profile 02/10/23

Gamma Profile 09/10/23

Overall gamma remains strongly negative and is likely to worsen.

Coincidentally, or perhaps not coincidentally at all, a two-legged break and test scenario coincides with a double market refusal to change gamma regimes.

Comparing the behavior of the SPX and SVIX (short Vix ETF), we found interesting divergences. The market tried to follow risk on but the SPX did not follow and now in the recent rebound initiated by Friday's short squeeze, the SVIX does not follow risk on.

It seems that this Monday's movement is led by our beloved ODTE options while the general market flow diverges completely with the market movement initiated last Friday.


At the same time, although the gamma exposure is huge, the skew does not seem to indicate that we have reached a panic zone and possible reversal, you still have a lot of room to run. It is certainly difficult to think of vigorous bounces that do not respond to short term oversold situations. At a certain point, the market regime shifts and behavior that was previously rewarded becomes behavior that is punished.
Now think, what short to medium term catalysts could trigger a change in market bias? we are only left with seasonality? The FED's thump on the table two weeks ago has turned the tide, and as Warren Buffet would say, it is now where you can see who is swimming naked.

Systematic flows and their "snowballing" influence on the market have created a synthetic situation in which it seems that risk does not exist, to the extent that childish and stupid narratives such as "softlanding" or the "new AI Bull market" have found justification among the majority of market participants. It is nothing new that price is always the element that generates the most excitement and can even hide realities. The volatility crunch perpetrated by systematic flows and option-derived flow seems to have its days numbered. The unwind of these positions is a risk in itself for the market, which arrives with its tongue hanging out, with many metrics for the history and justifying narratives completely disconnected from reality.
Passive management and the systematic flows of active management, combined with the market's favorite derivative instrument, are capable of generating this type of distortions in the short to medium term, but the macro cannot be neutralized or wiped off the map. The real economy has its times and although these flows can slightly delay the appearance of symptoms, they cannot prevent the patient from falling ill sooner or later.
From SpotGamma:
In our gamma topology, the downward facing bars in blue show net-negative gamma (heavy index put positions) and the up-facing bars in orange represent positive gamma (where call positions are dominant). This view here shows how SPY almost made it over that final hump of put gamma on Friday. This would have spelled for a different dynamic.

Looking back over recent developments, for a while 430/0 had the largest amount of put gamma. The equity market needed to break above that level before it could receive bullish flows from charm and vanna, or else those flows were bearish. Then what happened is the market became trapped in dangerous territory (strongly negative market gamma) for long enough that 420/0 built up put OI and became the new strongest put gamma level. 425 also has strong put gamma for SPY.
Being above those points is important because those puts begin to depreciate from time alone (charm) when otherwise time would be increasing their deltas and sustaining bearish flows. This last push above 430/0 would have been everything for puts to start vaporizing and initiate some vanna fuel.


