.png)


.png)
Higher oil prices contributed to concerns that inflation could prove more difficult for central banks to tame, spurring a sell-off in bonds. As the week wore on, the increasing likelihood of a U.S. government shutdown may also have weighed on investor sentiment.
The SP500 retreated for the fourth week in a row, slipping to its lowest level in nearly four months. The index fell less than 1% for the week, while the Nasdaq managed to post a fractional gain. The SP500 fell nearly 5% in September, declining for the second month in a row in a momentum shift that’s eroded much of the stock market’s year-to-date gains. At Friday's close, the index was down almost 7% from its July 31 peak.
With the notable exception of 2-year Treasuries, yields of most categories of government bonds extended their recent climb, with the 10-year Treasury yield rising above 4.50% for the first time since October 2007. Similarly, the 30-year yield eclipsed 4.70%, the highest since February 2011. The average U.S. mortgage rate climbed to the highest level in 23 years by one measure, and sales of new homes fell short of expectations. The government reported that new home sales fell 8.7% in August relative to July.
A U.S. labor market update due out on Friday will show whether the recent trend of a jobs growth slowdown extended into September. In August, the economy generated 187,000 new jobs, well below the monthly average of 271,000 jobs over the past 12 months. August’s unemployment rate rose to 3.8% as more Americans joined the workforce.
With an eleventh-hour deal reached to avert a U.S. government shutdown investors will be focusing on U.S. jobs data and speeches by Federal Reserve head Jerome Powell and European Central Bank President Christine Lagarde in the week ahead. Central banks meeting in Australia and New Zealand will also be in focus and markets continue to digest the ‘higher for longer’ interest rates mantra.
On Wall Street in the week ahead investors are likely to focus on crude oil prices as OPEC+ meet is slated to be held on Wednesday. Ministers from the Organization of the Petroleum Exporting Countries (OPEC) and allies led by Russia, known as OPEC+, will meet on October 4. Oil prices have soared towards $100 a barrel, the highest since 2022, on tighter supply, due to OPEC+ output cuts and rising demand.
Ahead of the third quarter earnings season, more U.S. companies have scaled back their earnings per share expectations than raised them. As of Friday, 74 companies in the S&P 500 had issued negative guidance versus 42 that provided a more positive outlook than they had previously, according to FactSet. Initial earnings reports are scheduled to be issued in mid-October, starting with some of the biggest banks.
The United States Securities and Exchange Commission (SEC) has delayed decisions on several spot bitcoin ETF proposals. The delays come just days after the commission delayed decisions regarding the Ark 21 Shares and GlobalX applications until January. Now, the SEC has delayed spot bitcoin ETF applications of BlackRock, Invesco, Bitwise, and Valkyrie, according to court filings filed on the 28th of September. The SEC had initially delayed spot Bitcoin ETF applications in August. The third set of deadlines for applicants is mid-January, with industry watchers anticipating the SEC to announce another delay then.
Macro y news
Economic Calendar:
Upcoming relevant events:
OCTOBER
▪️6: Employment report
▪️9-15: IMF World Bank meeting
▪️12: US CPI
▪️27: US PCE
NOVEMBER
▪️1: FOMC
▪️3: Employment report
▪️14: US CPI
▪️30: US PCE
U.S Macro data
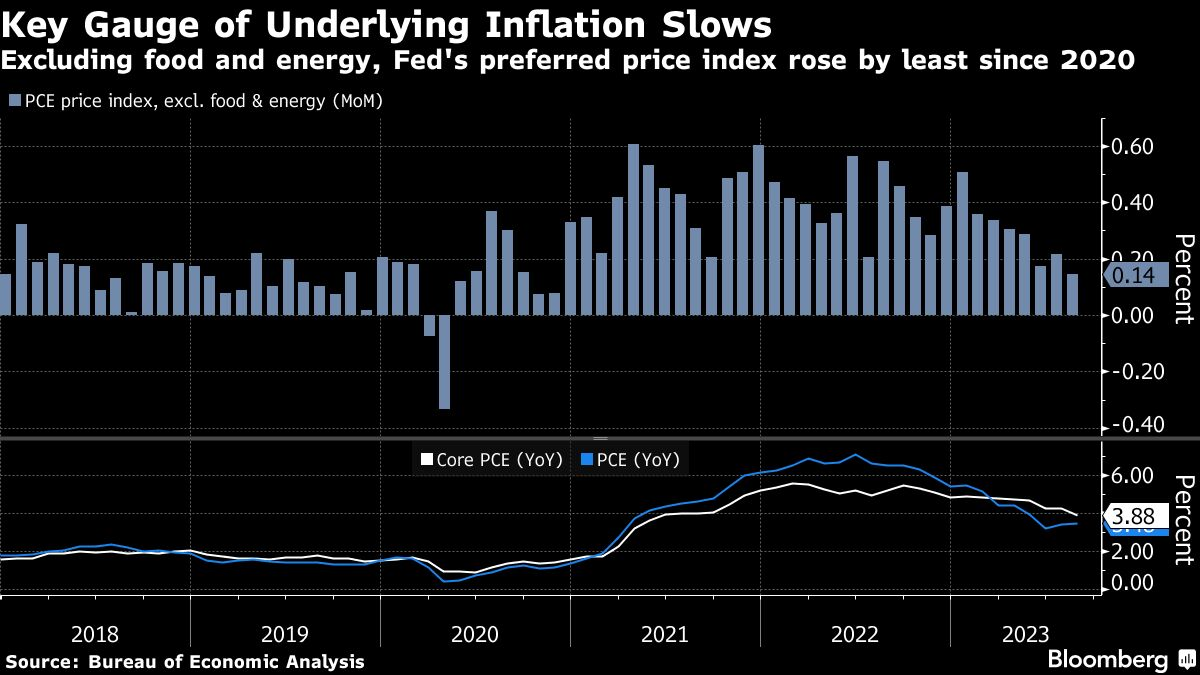
In August, the core personal consumption expenditures (PCE) index, which the Federal Reserve watches closely and excludes the volatile food and energy categories, increased 3.9% from year-ago levels, the lowest annual inflation rate in about two years but below the central bank’s 2% target.

This latest reading represents a moderation from the upwardly revised 4.3% annual inflation rate logged in July. On a month-over-month basis, core PCE inflation came in at 0.1%, which was below expectations. Including all items, monthly inflation quickened to 0.4% from 0.2% in July, mainly driven by higher energy prices.
Although recent manufacturing surveys have signaled weakness in new orders, durable goods orders and shipments increased month over month in August. Headline orders increased 0.2%, paced by strength in machinery. Consensus expectations had called for a decline. Excluding transportation, durable goods orders increased 0.4% from July. This metric, considered a near-term indicator of the economy’s health, omits the transportation category because the big price tags on aircraft and other equipment create the potential for large orders that can distort underlying trends.

Contracts to buy U.S. existing homes fell more than expected in August, tumbling by the most in nearly a year as high mortgage rates erode affordability, according to a survey released on Thursday. The National Association of Realtors’ Pending Home Sales Index fell 7.1% to 71.8 from July’s revised 77.3. The decrease, the largest since September 2022, exceeded the median economist forecast for a 0.8% fall, according to a Reuters poll.

The fall occurred as buyer affordability continued to decline last month. The average mortgage payment rose to $2,170 in August, up $331, or 18%, year-over-year, according to another data published on Thursday by the Mortgage Bankers Association.
The weekly average rate on a 30-year fixed mortgage has remained above 7% since early August following the Federal Reserve’s campaign to raise interest rates in an aggressive effort to curb inflation.


Eurozone macro data
A handful of European Central Bank (ECB) officials, including ECB President Christine Lagarde and Chief Economist Philip Lane.reaffirmed their commitment to maintaining a restrictive monetary policy for an extended period in an effort to bring inflation back to the 2% target.
Meanwhile, ECB Executive Board member Frank Elderson said in an interview with Market News International that rates have not necessarily peaked and that future monetary policy decisions would depend on incoming data. Austrian central bank Governor Robert Holzmann went a step further, suggesting in an interview with Bloomberg that persistent inflationary pressures may yet lead to further rate hikes.
Consumer prices increased 4.3% annually in September, weaker than forecast and the slowest pace in about two years. This inflation rate was a marked improvement from the 5.2% registered in August. The initial estimate of inflation data also showed that the core rate (a measure of underlying inflation pressures that excludes food, energy, alcohol, and tobacco) declined to 4.5% from 5.3%.


European government bond yields broadly climbed as investors focused on the higher-for-longer rates narrative in financial markets. Germany’s benchmark 10-year government bond yield rose to nearly 3%, a level unseen in more than a decade, before backing off this high on Friday. Italian bond yields also advanced amid concerns that the government would need to increase debt issuance next year to finance a bigger deficit.


Largest contraction in bank loans to euro area corporates in over two years. Adding to the evidence that monetary policy transmission is working.

The Netherlands Bureau for Economic Policy Analysis (CPB) released a report on World Trade Volumes that showed a significant dip in July. Global trade volumes have declined the most since the pandemic, falling -3.2% YoY and -0.6% MoM.

UK macro data
The UK economy grew faster than expected in the first three months of the year, according to revised figures for gross domestic product (GDP). The Office of National Statistics pegged first-quarter growth at 0.3%, as opposed to its previous estimate of 0.1%. Its estimate of second-quarter GDP growth was unchanged.

Meanwhile, the property market continued to slow. Bank of England data showed banks and building societies approved 45,354 mortgages for house purchases in August, down from 49,532 in July. Britain's housing market has been slowing for a year now, since bond market turmoil triggered by then-Prime Minister Liz Truss' September 2022 "mini-budget" led to a brief freeze in mortgage lending.
The BoE data also showed savers moving money from instant access accounts to those with longer-term fixed rates, to lock in higher interest rates, and a small net withdrawal from banks and building societies. The increased consumer borrowing and net bank withdrawals potentially show households being squeezed by the high cost of living, although the withdrawals could also reflect money being transferred to higher-yielding investments.
Mortgage lender Halifax said this month that house prices in August were 4.6% lower than a year earlier, the sharpest drop in 14 years.


Japan macro data
Japan’s stock markets fell, with the Nikkei down 1.7% and the broader Topix Index declining 2.2%. Concerns about U.S. interest rates potentially remaining higher for longer and the soaring price of oil weighed on sentiment. However, investors welcomed the Japanese government’s announcement of a new economic stimulus plan.
The yen traded mostly within the JPY 148 range against the USD, although it briefly weakened past JPY 149 to hit an 11-month low. This added to speculation that Japanese authorities could intervene in the foreign exchange market to prop up the yen, having repeatedly stated that they would respond appropriately to rapid currency moves. However, Finance Minister Shunichi Suzuki denied that the authorities have in mind a specific level for the U.S. dollar-Japanese yen exchange rate that would trigger an intervention.
The yield on the 10-year Japanese government bond (JGB) rose to 0.76% from 0.74% at the end of the previous week. The JGB yield reached its highest level in over a decade, despite the BoJ stepping into the market to buy JPY 300 billion (USD 2 billion) of JGBs with maturities between five and 10 years. This follows the BoJ loosening its yield curve control policy in July to allow rates to rise more freely, although it effectively caps them at 1%.


Prime Minister Fumio Kishida outlined a new economic stimulus plan, the details of which are to be decided in October and which will be funded by a supplementary budget. The plan is aimed at bringing about a virtuous cycle of capital investment, wage growth, and investment in people. One focal point is supporting long-term investment in growth fields such as semiconductors, batteries, and biotechnology. Also under consideration is the extension into next year of what had been a temporary subsidy to mitigate soaring energy prices.
China macro data
Chinese stocks fell in a holiday-shortened week as a lack of positive news on the economy dampened investor sentiment. The blue chip CSI 300 Index and Shanghai Composite Index both fell for the week ended Thursday. Stock markets in mainland China were closed Friday, the start of a 10-day holiday for the Mid-Autumn Festival and National Day, and will reopen Monday, October 9.
No official economic indicators in China were released during the week. But a private survey showed that prices in China are recovering, assuaging fears of a prolonged deflation. World Economics reported that its all sector price index for China rose to a 14-month high in September.
The World Economics survey was the latest data point indicating that China’s economy may have bottomed after losing momentum following a brief post-lockdown recovery in the first quarter. Official data for August released earlier in September also pointed to signs of stabilization in the Chinese economy. Industrial production and retail sales grew more than forecast year on year, while unemployment unexpectedly fell from July.
Bonus Macro Data: Global trade, US Job data and Credit stress
Global trade
Global trade fell at the fastest annual pace since the first Covid-19 restrictions of 2020, reflecting slowing global demand as interest rates rise.

Level of World Trade Volume Index (blue) has fallen to lowest since October 2021 index has fallen by more than 4% year/year (orange), which is consistent with prior recessions.

Looking up the PMI data from SP Global and while we look at this on a monthly basis, a detailed look in the context of Global Trade Volumes is useful. Clearly, what we see is that new orders have been drying up and they are closely correlated with trade. If you look at the PMIs even at a country level, while prices are holding steady, new orders are not. This is particularly true for the developed countries, where the aggressive rate hiking cycle has definitely dampened demand.
With interest rates increasing we’ve also been seeing a decline in credit. Whether this stems from banks tightening their lending standards or from companies not demanding loans, the end result is the same. Trade finance is a major contributor to global trade volumes and the lack of financing means less business.

US Job data
Permanent job losses have risen aggressively.

Job openings is an accurate leading indicator for the unemployment rate. Job openings have been plummeting, indicating that the unemployment rate is bound to move higher

The labor market might be on the brink of rapidly deteriorating. Yield curve steepening from inverted levels has coincided with sharp rises in the unemployment rate.

Total trucking employment index fell sharply last month and very sharply relative to 2000/08, expect that some of this drop has to do with the recent strikes. The freight sector is saying 'red alert' recession risk.

Credit stress


Unrealized losses on investment securities for banks are skyrocketing. For Q2 2023, there are nearly $550 billion in unrealized losses. To put this in perspective, that’s nearly 25% of all banks’ equity capital.As interest rates rise and remain higher for longer, this trend is becoming more prominent. What happens if banks realize these losses?

Unrealized losses on investment securities have skyrocketed recently. Unrealized losses accounted for 33% of all bank equity capital. This is a very important trend to watch into 2024.

Crypto News
=> The SEC has again delayed decisions on BlackRock and Invesco's Bitcoin ETF applications. The regulator also postponed Bitwise and Valkyrie's requests. Despite a mid-October deadline, the race for a US Bitcoin ETF continues, with over 10 firms awaiting SEC approval. The SEC's final ruling could extend to March 2024.
=> Stablecoin issuer Circle steps up in the SEC's case against Binance, asserting stablecoins like USDC shouldn't face the same regulations as other cryptocurrencies. Circle contends that standalone purchases don't bring profit, exempting them from SEC oversight.
This move challenges the SEC's claims on Binance's BUSD. However, companies like Binance and Coinbase continually argue against stringent rules. The outcome may set a precedent for the future of stablecoins in the U.S. financial landscape.
=> Valkyrie launches Ethereum Futures ETF, first of its kind.
=> Stablecoin issuer Circle launched its fiat-backed EURC stablecoin on the Stellar network, the third blockchain to host the currency after Ethereum and Avalanche.
=> Hong Kong's Securities and Futures Commission (SFC) announced new measures to improve transparency and security in the cryptocurrency space. The initiative comes as authorities in the semi-autonomous city-state grapple with the JPEX incident: a case of alleged scam involving a Dubai-based cryptocurrency exchange operating in Hong Kong territory without a license.
There are estimated to be at least 2,305 victims of the incident, who collectively have been swindled out of HK$1.43 billion ($182.9 million), making JPEX one of the largest financial fraud cases in Hong Kong's history.
=> Central Banks collaborate to test CBDCs in France, Singapore, and Switzerland.
=> Georgia selects Ripple Labs as potential limited live CBDC partner.
=> Crypto.com partners with PayPal and Paxos to become preferred PYUSD exchange
=> Mixin Network, a peer-to-peer digital asset platform based in Hong Kong, was hacked and nearly $200 million was stolen. The breach, which was linked to a third-party cloud service provider, resulted in the suspension of deposit and withdrawal services immediately. However, Feng Xiaodong, the company's founder, promised compensation with a 50% cap and the remainder in bond tokens. This suspension of services will continue until vulnerabilities are resolved.
=> Huobi Global (now HTX) crypto exchange suffered a major blow on Sept. 24, as hackers made off with 5,000 ETH, totaling $8 million. However, founder Justin Sun assured users that all losses were covered.
In a unique twist, HTX offered the attacker a 5% "white-hat bonus" of $400,000, provided the stolen funds were returned. If not, law enforcement will be brought in. Despite the breach, HTX remains resilient, with normal operations and user assets intact. This incident follows Huobi's recent rebranding to HTX.
=> Binance Sets Sights on Asia with Plans to Launch New Stablecoin in a Partnership with Japan’s Largest Financial Group.
=> Binance fully exits Russia with sale to Commex
=> Coinbase successfully registers with Spain’s Central Bank.
=> Kraken expands European reach with registrations in Spain and Ireland.
=> Epic Games, creator of Fortnite, is letting go of 16% of its staff, impacting 870 employees. CEO Tim Sweeney admitted overspending and investing heavily in Fortnite's metaverse, leading to financial strain. The move includes divesting Bandcamp and spinning off SuperAwesome.
Sweeney expressed regret over the layoffs but assured a robust severance package. The company also faces a legal battle with Apple. Despite challenges, Epic remains focused on key projects, including Fortnite's next season. This significant restructuring aims to ensure long-term financial stability amid the ever-evolving gaming landscape.
=> MicroStrategy acquires additional 5,445 Bitcoins for $150 millions and now Holds 158,245 BTC.
Cryptos: spot, derivatives and “on chain” metrics
Bitcoin (BTC) held steady at around $27,000 for the past week, while most other top altcoins saw little to no growth. Bitcoin Cash (BCH) and Chainlink (LINK) were the exceptions, with gains of over 14% and 13%, respectively.
LINK's rise was catalyzed by news that the network has extended its cross-chain interoperability capabilities to Coinbase Base's Ethereum layer-2 network. By integrating its Chainlink Interoperability Protocol (CCIP) with Base, the two networks can now interact, send messages, transfer tokens and perform other functions. Chainlink is also the primary oracle of the Base network.
United States-based financial services firm Valkyrie Funds LLC recently received the approval to offer Ethereum futures in its existing exchange-traded fund (ETF). Valkyrie’s latest move pushed ETH’s price to a three-week high of $1,686, adding more than $8 billion to the cryptocurrency’s market capitalization. The altcoin’s popularity soared as on-chain analytics from Santiment showed Ethereum trending online.
Moreover, the crypto market has had a pretty rough week, with Mixin Network and HTX crypto exchange losing millions of dollars to hacks, crypto influencer BitBoy Crypto being arrested while live streaming, and Epic Games laying off 870 employees due to failed metaverse ambitions.
Gainers / Losers last 7 days, block size volume.

Bitcoin
In terms of price dynamics, few changes compared to last week, the market continues to defend itself from further declines below the VWAP (white arrows) anchored at the lows of the bullish trend that was born at the end of March. However the minor cumulative structure above this Vwap has left a first bullish continuation failure with re-entry to the value of this minor structure. Demand has reacted on the VPOC and seems to be attempting a new imbalance.
As can be seen, this minor value area has attempted two upside imbalances without much success and now we are on the third attempt. The $26000 level is seen as a minor buying control zone, if lost, it would open the door to further declines and a change of scenarios in major price dynamics.
We continue to insist that in order to propose long scenarios, Bitcoin must recover and conquer the High Volume Node (HVN) of $28100, coinciding in turn with the VWAP anchored at local highs. Once this zone is conquered, the attack on the sell initiative zone should begin, which we will discuss in detail in shorter-term charts.
Bitcoin 25/09/23 30 min chart

Bitcoin 02/10/23 30 min chart

In the following low time frame charts we can see perfectly how the demand was not managing to unbalance to the upside, there are already two unsuccessful attempts. It is now key to observe if this re-entry into the range with demand reaction in the Vpoc will allow to maintain enough buying initiative to unbalance the lower structure even in a third attempt.
A coherent long scenario would pass through 3 requisite, effective imbalance to the upside, conquest of the Vwap anchored at local highs and neutralization of the sell-side initiative zone ($30300), which has been configured as a strong resistance recently. Sunday's close of the week suggests that the market is trying to meet these three requirements.
On the other hand, the market must not lose the $26000 level, the buyer control zone of all this minor value area, losing this buyer control would open a window of opportunity for the bears.
Bitcoin 25/09/23 30 min chart. Small picture

Bitcoin 02/10/23 30 min chart. Small picture

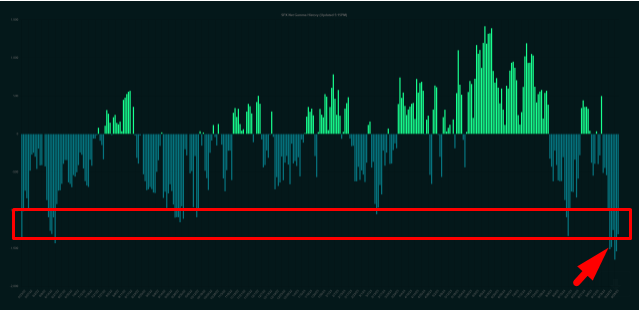
Looking at the open interest of stablecoin collateralized futures it appears that the market was heavily biased to the downside. The drop in open interest and short liquidation with this mysterious spike has been significant. Can a market initiate a bullish move in these conditions? no doubt, but as we always insist it has to be accompanied by a buying initiative in the spot market.

Not really surprised by this move especially with the rotation out of shorts and strong perpetual bid prior to this pop. Note the buying pressure in terms of delta of these whales with orders between 100k- 1million before the spike.

Ethereum
After crashing back into the Vwap anchored at all time highs, the market has returned with vigor to the demand zone between $1700 and $1500. Even with the news of the approval of the ETH futures ETF., the market reaction in the demand area has been quite poor. This zone is key, as the loss of this zone would mean that sellers are back in control.
Consistent long scenarios require seeing price vigorously break out of the demand zone to subsequently conquer the Vwap anchored at all-time highs. The big battle for the bulls lies there, neutralizing that clear sell zone at the Vwap.
Ethereum 25/09/23 4h chart

Ethereum 02/10/23 4h chart

BNB
We will closely monitor the evolution of BNB as a measure of risk perception. BNB is the cryptocurrency coin that powers the BNB Chain ecosystem. BNB is one of the world's most popular utility tokens and it is used primarily to pay transaction and trading fees on the Binance exchange. It is Binance's flagship token.
At first glance we note that the Vwap anchored at highs has never been exceeded or practically tested since late 2021. The vigorousness with which the Vwap anchored at the local lows of June 2022 has been broken through makes us aware of the major weakness on this token.
Clearly, the area to watch is the historical support at $220 and we are already in this area with little reaction, from there Binance could start to have problems. We believe it is very necessary to follow very closely the evolution of this token, as it could anticipate a new CEX crisis.
BNB 25/09/23 4h chart

BNB 02/10/23 4h chart

Classic markets
The SP500 wrapped up a fourth straight week of losses and a nearly 5% decline for September, its worst monthly performance since December, as investors come to grips with the Federal Reserve's message of higher-for-longer interest rates. Surging crude oil prices along with fears of increased supply of government debt helped propel bond yields, with the benchmark 10-year Treasury yield reaching near 16-year highs during the week. Two of the three major stock market indexes posted modest declines for the week, with the Dow Jones down 1.3% and the SP500 slipping 0.7% while the Nasdaq eked out a 0.1% gain.
SP500 equal-weighted index has fully retraced its 2023 up move.

US small caps relative to the SP500 have just dropped to levels unseen since Oct 2002.

If stocks entered a new bull market last October, you'd never know it by looking at the small caps: In fact, this would be the weakest small-cap start ever for a new bull, which is not good, considering small caps normally outperform on the way up.

In case you haven't seen it. Here is what the market looked like in the summer prior to the '87 crash.

The 10-Year Treasury bond is down 3% this year, on pace for its 3rd consecutive annual decline. With data going back to 1928, that’s never happened before.


Investors continue to jump into the Treasury trade TLT, with more than $16 billion of inflows to the ETF in 2023.That's the second largest YTD inflow for an ETF.

Hedge Funds continue to short treasuries at historic levels while asset managers are building their largest long positions ever recorded!

We’re two weeks away from the beginning of Q3, 2023 earnings season. ~90% of the SP500 have entered the blackout period as of this weekend. The blackout period is significant because this is the time when companies cannot buyback their stock. But, this period is also known as the quiet period and it’s the time when companies cannot divulge any information surrounding their performance prior to their earnings release. Ideally, volatility should be low during this period but, given how the market dynamics have changed because of options, that may no longer be the case.
According to FactSet, the expected blended earnings growth rates for the upcoming Q3, 2023 results are:
SP500 = -0.39% (Q2 was -4.1%)
Nasdaq 100 = +12.32% (Q2 was +16.23%)
There are a few things to consider this earnings season:
- The decline in inflation will mean companies with pricing power who increased prices will have to reverse the situation, i.e., adjust prices downwards. We’re likely to see revenues decline YoY for most companies not just because of a decline in pricing though, but also because demand has declined.
- While energy costs have increased, we may not readily see the impact this quarter for ex-energy companies. However, one thing to remember is that a spike in oil prices is not always passed on to the consumer. What we saw over the last couple of years was more the effect of the supply chain challenges.
- US Dollar strength however, may have a more immediate impact on revenues and earnings. Trough to peak, the US Dollar Index is up almost 7% in the third quarter.
- Wage costs will be interesting. We’ve seen wage costs increase in certain sectors and some tightness still remains in select sectors. This will be an important component to follow.
- The consumer is weaker. Over the first two quarters, we still had the residual impact of fiscal stimulus in the system with cost of living adjustments, SNAP benefits and stimulus checks. Much of the excess savings from the pandemic period are now gone. I’m sure you’ve seen plenty of charts to attest to that. But, as well there was a ballooning of credit. Unfortunately, we’re seeing the interest burden affect the consumer now and delinquencies are rising rather rapidly, reaching almost pre-pandemic levels.
- Many of the tech companies were quick to cut costs and adjust to the new normal. Whether the cost cutting will be sufficient to sustain profits in the face of lower demand remains to be seen.
The SP500 EPS yield is now less than that available in 3-month Treasuries.


On the graph below, significant changes in Fed Funds Futures, or market expectations for future interest rates, can be seen between early September and the outcome following the so-called “hawkish pause” by the Federal Reserve. Compared to the beginning of September and the rate expectations after the FOMC, the market had fully priced in nearly two 25 bps rate cuts. That is the result of Mr. Powell's highly effective and hawkish message.
Although FOMC members disclosed that 12 of 19 members are in favor of another rate hike before the end of the year, the market appears to be pricing in a peak rate near 5.45% (according to FFF), or a probability of a rate hike near 50% until December. The market is considerably less optimistic than FOMC participants, of whom 63% anticipated another rate hike until December 2023.

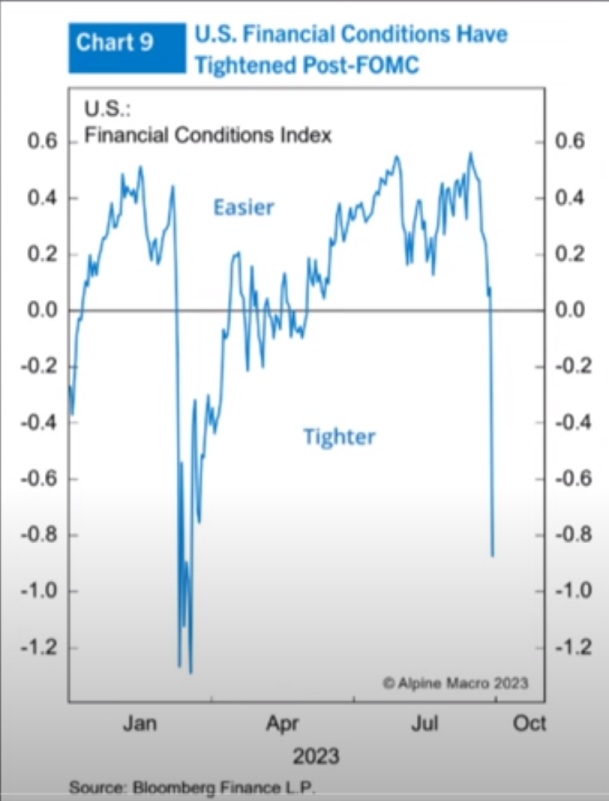
The Goldman Sachs Financial Conditions index appears to have broken free of a downtrend that started following its peak in October 2022. From a technical standpoint, it would appear that those financial conditions could now be on the cusp of rising further and returning to those October 2022 highs. That is because real yields have risen dramatically, with the 10-year real yield surging to 2.23%. That is easily the highest level of real yields in the past decade and is likely to lead to even tighter financial conditions.

However, while real yields have consistently risen since early May, the equity market took a different turn. At that point, the spread between the earnings yield of the Nasdaq and the 10-year really tumbled to just 1.55%, its lowest level since 2007.

Since the July 24 FOMC meeting, when the Fed last raised rates by 25% bps, the NASDAQ earnings yield has again been trading with the 10-year real yield.

This two-month period between May and July seemed to resonate not only with stocks but with high-yield debt because it was during that time that financial conditions started to ease materially, and the CDX high yield index moved lower as well, despite real yield climbing. But that all appears to be over now, with real yields breaking out and credit conditions starting to tighten again. The earnings yield of the Nasdaq trades most closely with changes in credit spreads, and one would expect that if credit spreads and financial conditions continue to tighten from here, stocks will be forced to go lower.

There is good reason to think those credit spreads and conditions can continue to tighten. In the most basic sense, we haven't seen them keep up with the recent rise in real and nominal yields, and if the Fed intends to keep rates higher as the dot plot implies, then it would seem those spreads now need to make up for lost time and essentially for being wrong.
The relationship between the VIX and the Canadian dollar demonstrates the relationship of dollar strength the best with implied volatility. When the USDCAD exchange rate rises, it is an indication of the dollar's strength, and when the USD exchange rate falls, it is an indication of a weaker dollar. The stronger dollar and tighter monetary policy should tighten financial conditions, increasing implied volatility in the equity market.

This means that the dynamics for the end of 2023 appear to be returning to those witnessed in the first nine months of 2022, which is that high rates and a stronger dollar tighten financial conditions and increase implied volatility. That will make it a hostile environment for stocks for the fourth quarter of 2023 as long as this trend persists because the equity market's bet on numerous rate cuts was wrong, and now it will have to pay for its mistake.
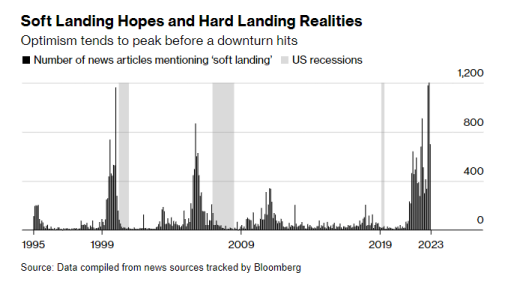
The market has recently rotated from softlanding to seasonality in Q4 is favorable. The fourth quarter has historically seen positive returns, particularly after a third-quarter decline. The media and therefore market participants are grasping at this narrative like a nail in the coffin, will this time be different?


Nothing has changed over the past week, in terms of price dynamics, if the market does not manage to recover the June VPOC, a clear buying trench in recent months, it seems inevitable that the market will look for the price congestion zone it built up between April and May of this year.
We are dangerously close to the sell trigger zone (4350-4250) of the systematic strategies. Let us not forget that these strategies, which do not respond to macro or fundamental criteria, have been the main source of market demand for almost this past year. It appears that the market's favorite "crunch vol" trade may no longer work, causing many market participants to receive an accelerated and painful lesson in macroeconomics.
25/09/23 SP500 4h chart. Big picture
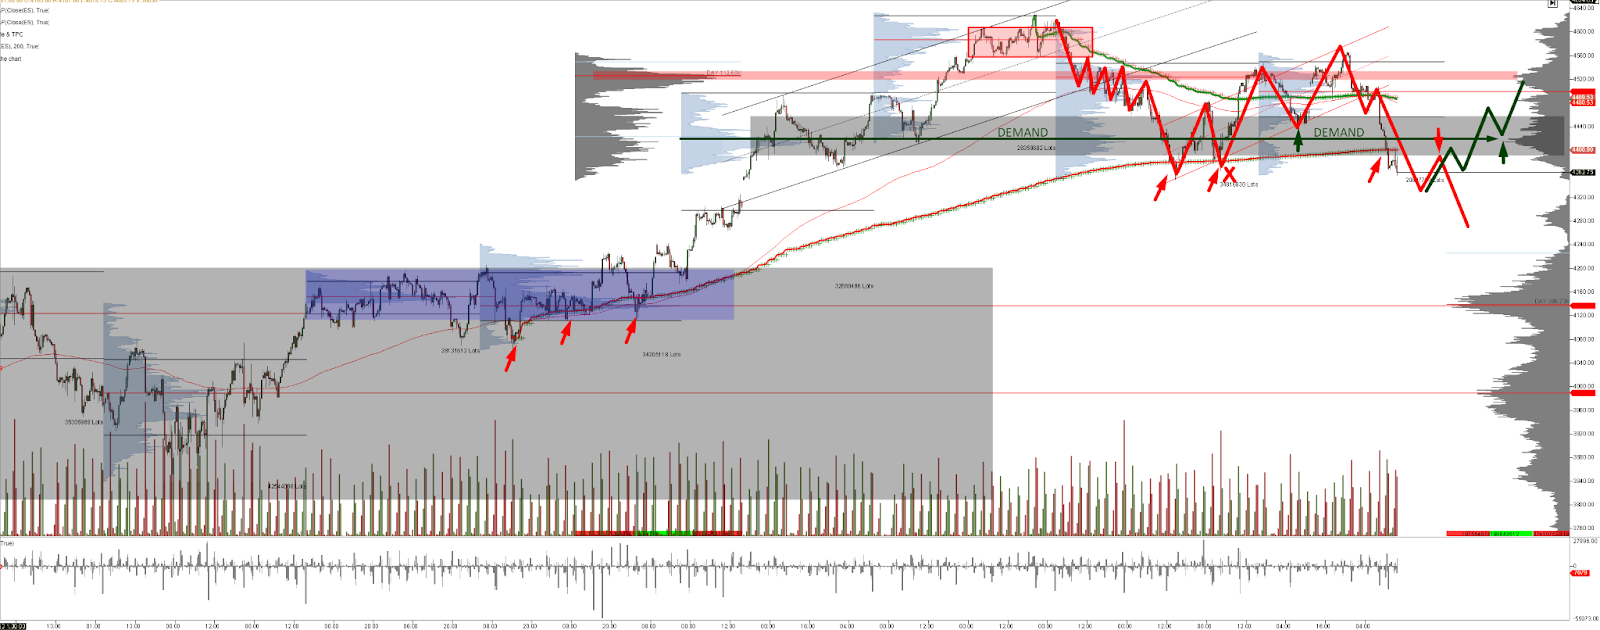
02/10/23 SP500 4h chart. Big picture

Moving down the timeframe on the charts, we clearly see that the market is still below the buy control zone established since last June. As long as the bulls do not manage to regain this control, there is no seasonal pattern or oversold indicator that will work. The market is undoubtedly in a fragile situation not seen this year, this week will be key to know the strength of the bulls and their narratives.
25/09/23 SP500 futures small picture

02/10/23 SP500 futures small picture

This key moment forces us to go even further down the timeframe in the charts. This is where we clearly see the defense on the demand side, probably driven by the monetization of puts that has forced the Market Makers to unwind their short hedges to maintain their delta neutrality.
We do not see price dynamics with strong demand strength. Friday's abrupt close has led the market to test the buying trench (Vpoc of this minor structure). If this zone is lost, the market could enter panic mode. On the other hand, if the market has found enough buying initiative after this abrupt test to the Vpoc, the demand must manage to consolidate above the red value area to go to test areas close to the VPOC of June, there lies the big test for the bulls.

The gamma profile is representative of how much market sentiment has changed. Note the notional gamma accumulated in lower strikes relative to the last gamma profile published in last week's newsletter. It is important to monitor now the possible monetization of puts on those relevant strikes either by taking profit or by a general relaxation of the post-Fed sentiment. Again, in the short to medium term, we do not see strong enough catalysts to trigger a market reversal.
Gamma Profile 25/09/23

Gamma Profile 02/10/23

From SpotGamma:
This past week had:
The highest number of index put options ever bought to open (orange, top) but also the highest number of index put options ever SOLD to open (orange, bottom) this is driven by 0DTE.

Measuring activity from premium you see flow that is likely driven from longer dated options activity. In this case you can see both puts bought to open (orange, left) and sold to open (right) are both elevated, but not above recent highs.

When you net out all puts bought vs sold, you see that Index puts were net sold this past week, with calls net bought.

Be very careful with quick and extremely simple put/call ratio interpretations observed during the past week, indicating a market floor. Remember calls / puts are bought and sold and market participants will continue to do what has been working for many months until it stops working.

It is curious how a 5% drop in the SP500 during the month of September has triggered a rally in bearish sentiment almost as large as that of March 2020, when stocks plunged 30%. We live in a market of extremes where the narratives that underpin it hide an implicit fear unparalleled.

Implied SPX dealer gamma remains in deep negative territory, so volatility is guaranteed.
The market is in wild negative gamma exposure and getting dangerously close to the long-term triggers of systematic flows. If you think the market is oversold, just wait for those trigger levels to break. At the same time, although the gamma exposure is huge, the skew does not seem to indicate that we have reached a panic zone and possible reversal, you still have a lot of room to run. It is certainly difficult to think of vigorous bounces that do not respond to short term oversold situations. At a certain point, the market regime shifts and behavior that was previously rewarded becomes behavior that is punished.
Now think, what short to medium term catalysts could trigger a change in market bias? we are only left with seasonality? The FED's thump on the table two weeks ago has turned the tide, and as Warren Buffet would say, it is now where you can see who is swimming naked.

Systematic flows and their "snowballing" influence on the market have created a synthetic situation in which it seems that risk does not exist, to the extent that childish and stupid narratives such as "softlanding" or the "new AI Bull market" have found justification among the majority of market participants. It is nothing new that price is always the element that generates the most excitement and can even hide realities. The volatility crunch perpetrated by systematic flows and option-derived flow seems to have its days numbered. The unwind of these positions is a risk in itself for the market, which arrives with its tongue hanging out, with many metrics for the history and justifying narratives completely disconnected from reality.
Passive management and the systematic flows of active management, combined with the market's favorite derivative instrument, are capable of generating this type of distortions in the short to medium term, but the macro cannot be neutralized or wiped off the map. The real economy has its times and although these flows can slightly delay the appearance of symptoms, they cannot prevent the patient from falling ill sooner or later.