.png)


.png)
Stocks ended their worst week in a month with more losses Friday, marking the third straight daily loss for the Dow Jones and the fourth for the S&P 500, weighed by spiking Treasury yields and concerns that Israel's conflict with Hamas could escalate into a wider Middle East war. The Nasdaq Composite Index fared worst among the major benchmarks and nearly moved back into bear market territory, ending the week 19.91% below its early-2022 intraday highs. Relatedly, growth stocks lagged their value counterparts.
Stocks started the week on a strong note, marking the 15th straight Monday of gains for the S&P 500, seemingly helped by limited negative news flow regarding the Middle East over the weekend. Deepening tensions later in the week appeared to drain the gains, however. In particular, shares fell sharply on Thursday afternoon, following reports that a U.S. Navy destroyer had shot down a cruise missile apparently headed toward Israel. Reports of a drone attack on a U.S. base in Iraq also seemed to weigh on sentiment.
Also adding to the gloomy atmosphere on Wall Street was hotter-than-expected retail sales data along with mixed commentary from a host of Federal Reserve speakers, chief among them being chair Jerome Powell's remarks at an event at the Economic Club of New York. Most of the officials hinted that interest rates could be kept steady, leading the market to bolster their bets for no more rate hikes this year. The yield on the benchmark 10-year Treasury crossed 5% for the first time in 16 years on Thursday, a level that could ripple through the economy in higher rates on mortgages, credit cards, auto loans and more, plus, it offers an attractive alternative to investing in stocks.
The U.S. government on Thursday is scheduled to release its initial estimate of third-quarter economic growth, with most economists expecting that GDP growth remained solidly positive, despite some earlier predictions that the economy could be on the verge of a recession. The upcoming report comes a month after the government revised its second-quarter GDP estimate to an annual growth rate of 2.1%, down from 2.2% in the first quarter.
A huge week of earnings reports has the potential to shift the focus of investors away from the headlines on the Middle East and surging Treasury yields. Some of the heavyweights due to report include Amazon, Microsoft , Meta Platforms, Coca-Cola, AbbVie, and Chevron. Earnings estimates for the fourth quarter are falling, and the bad news is that third-quarter results have only started. It will be hard to justify the SP 500 lofty valuation if earnings growth for the index continues to vanish, meaning the overvalued equity market will have no legs to stand on.
The European Central Bank will announce its interest rate decision on October 26. The ECB is expected to hold rates steady after firing off 450 points of rate hikes since July 2022. As for the Federal Reserve, members will be in a blackout period ahead of the next FOMC meeting in November, but the "higher for how much longer" guessing game will go on.
It was a week ago when bitcoin skyrocketed by $2,000 in hours following a false report claiming that the SEC had finally approved a spot BTC ETF. Once that was rebutted, the cryptocurrency plummeted back down to $28,000. However, the bulls kept control of the market and gradually pushed BTC toward $29,000 during the week. Once Friday came, they drove the asset to above $30,000 for the first time in August. After a brief retracement, bitcoin went on the offensive once again during the weekend, and especially earlier today. As reported, the asset touched $31,000 during the Monday morning Asian trading session, which became its highest price tag since mid-July.
As of now, BTC stands a few hundred dollars below that local peak. Its market cap has neared $600 billion, while its dominance over the altcoins has been reduced slightly to 51.4% on CMC. Chainlink has been among the top performers lately, the popular altcoin has only doubled down in the past 24 hours. LINK has jumped by another 13% since Sunday and now stands at a multi-month peak of its own at over $10.
Macro y news
Economic Calendar:

Upcoming relevant events:
OCTOBER
▪️27: US PCE
NOVEMBER
▪️1: FOMC
▪️3: Employment report
▪️14: US CPI
▪️30: US PCE
Earnings for next week:
U.S Macro data
Fed policymakers remain “unconvinced” inflation is tamed
We have clearly entered a new period in the monetary policy cycle, which could be summed up as feeling your way through it. It seemed pretty clear from an interview on October 19 with Jay Powell at the Economic Club of New York that the Fed isn't sure how far rates may have to rise, how long they may have to stay high, or where the longer-run rate may be.
What is also clear is that the Fed doesn't even know if rates have been high enough for long enough yet or if we have or haven't seen the full effects of monetary policy yet. It also seems to be the case that Powell doesn't think that policy is too tight at this point.
Overall, the bond market seemed to take the message exactly as intended from Powell. The result was a 30-year rate exploded higher to reach 5.1%, and the 10-year increased to 4.99%. The 2-year rate moved slightly lower as it adjusted for a potential short-term pause from the Fed, allowing the yield curve to bear steepen, which is when the back of the curve rises to the front of the curve.
The bond market (LQD) has a good record of predicting future Fed rate movements. Specifically, the 2-year Treasury (US2Y) interest rate does a very good job of forecasting Fed rate changes over the next 6 months or so. For example, the 2-year Treasury yield began rising about 6 months before the Fed began hiking in early 2022.
Admittedly, the 2-year doesn't have a perfect track record. In the Spring of this year, the 2-year dipped, indicating that the bond market expected the Fed to pause rate hikes indefinitely. And the Fed did pause... for one meeting. The 2-year jumped back up as it became clear that the Fed was going to do at least one more hike. Today, the 2-year climbed to its highest level since the 2000s, but it still remains below the FFR. Historically, this inversion of the 2-year yield and FFR is another recession indicator, like the inverted 10-year / 2-year Treasury yield curve.

For as long as the 2-year Treasury rate stays above the FFR during rate-hiking cycles, the bond market is predicting that the Fed will hike further. But when the FFR rises above the 2-year yield, the bond market is signaling that Fed rate hikes will pause soon and go lower in the near future. Today's situation in which the 2-year is rising but remains below the FFR isn't totally unprecedented. Before the 2008 recession, the 2-year was range bound for a little while and saw a few spikes even as it remained below the FFR.
The Fed appears to be using forward guidance as a monetary policy tool right now. The intended effect is to alter the market's expectations so that consumers pull back on spending, long-term interest rates rise, and, ultimately, inflation sustainably falls to the Fed's 2% long-term target.
Some upside economic surprises may have reinforced worries that rates would remain “higher for longer.” On Tuesday, the Commerce Department reported that retail sales rose 0.7% in October, roughly double consensus expectations. The increase was particularly strong among online retailers and at restaurants and bars, indicating continued strength in discretionary spending. Over the preceding 12 months, however, sales rose 3.8%, roughly in line with consumer inflation


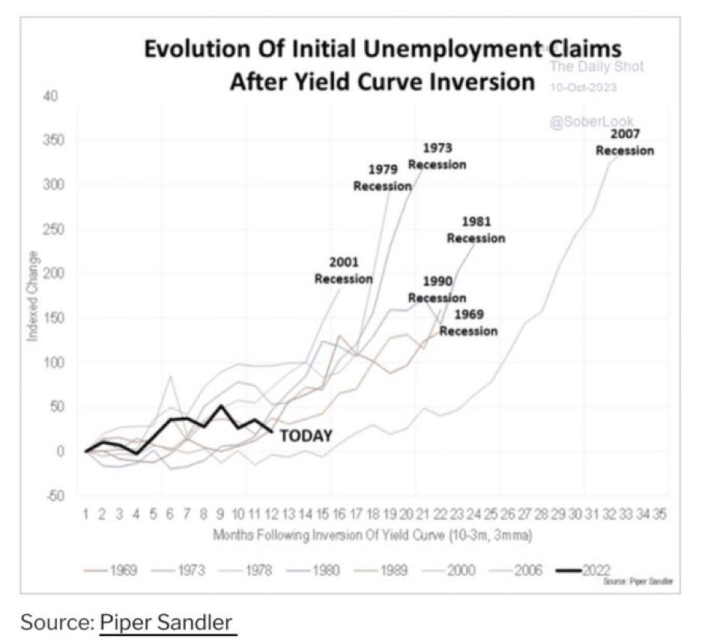
Initial claims for state unemployment benefits dropped 13,000 to a seasonally adjusted 198,000 for the week ended Oct. 14, the lowest level since January. Economists polled by Reuters had forecast 212,000 claims for the latest week. Though the labor market is gradually cooling, conditions remain tight, with claims at the very low end of their range of 194,000 to 265,000 for this year. Unadjusted claims declined 18,561 to 181,181 last week.

However, Permanent job losses have been accelerating aggressively. This metric used to be around -60% in June 2022 and now stands at a staggering 19.9% in Oct 2023. Big spikes in this indicator have systematically led to a recession. Current rate of increase is comparable to the Dot Com bubble, Financial Crisis and the Pandemic, all 3 ended with a sharp economic downturn and a sharp rise in the unemployment rate.

Commerce data showed the industrial side of the economy remained considerably weaker, however. Overall industrial production picked up by 0.3% in September but remained roughly flat over the preceding year (up 0.8%).

The housing sector also demonstrated the impact of rising rates, as well as the tight labor supply. September housing starts rose more than expected, but building permits, a more forward-looking gauge, fell 4.4% in the month, the sharpest decline in 10 months. With the average rate on the popular 30-year fixed mortgage vaulting to a nearly 23-year high of 7.63% last week, according to data from mortgage finance agency Freddie Mac, home resales are likely to decline further.

This has been one of the most aggressive tightening cycles in US history. High-interest rates have caused the US 30-year fixed mortgage to hit a staggering 8%. As a result of higher mortgage costs, homeowners looking to refinance their mortgages have plummeted.


Cost of Capital for the median company in our coverage has risen to 9.6% currently vs. 8.5% on average during 2022. The rising costs of corporate debt are likely to diminish business activity and even cause vulnerable companies to fail:
- Lower investment
- Less job openings, in some cases outright firings
- Increased probability of unprofitable companies going bankrupt

Leading Economic Index (LEI) from The Conference Board has declined for 18 consecutive months, which has only happened in recessions that took place in 1970s and 2007-2009.

Eurozone macro data
Euro zone inflation came in at an annual 4.3% in September, European Union statistics agency Eurostat said Wednesday, confirming earlier estimates.The headline consumer price index slowed markedly from August’s 5.2% annual increase, though inflation rates continued to diverge sharply across the bloc.

Several European Central Bank (ECB) policymakers, including ECB President Christine Lagarde, Robert Holzmann of Austria, and Yannis Stournaras of Greece, highlighted the inflation risk posed by the rise in oil prices ignited by fighting in the Middle East. Meanwhile, ECB Chief Economist Philip Lane told a Dutch newspaper that the central bank may need to wait until the spring before it can be confident that inflation is returning to the 2% target. Bundesbank President Joachim Nagel echoed Lane’s comments, adding that price pressures remain “too high” in the eurozone, and “upside risks are still pretty present.”
German investor morale improved more than expected in October, driven by expectations of further declines in inflation and stable short-term interest rates in the eurozone, according to the ZEW economic institute. In France, however, business confidence fell across most sectors of the economy in October, according to the official statistics agency.

UK macro data
Inflation in the UK unexpectedly held steady at an annual rate of 6.7% in September due to rising gasoline prices. Services inflation accelerated to 6.9%. Separate data showed that, in the three months through August, wage growth, excluding bonuses, rose 7.8% year over year, close to the record high. Bank of England (BoE) Chief Economist Huw Pill said before the release of the data that policymakers “still have some work to do” to ensure that inflation returns to the 2% target.
A future British government should consider raising the Bank of England's inflation target from 2% to 3% to give it more room for maneuver during economic downturns and ease the burden on the public finances, a leading think tank said on Thursday.

Japan macro data
The yield on the 10-year Japanese government bond rose to 0.83%, its highest level in around 10 years, from 0.76% at the end of the previous week. The Bank of Japan (BoJ) adjusted the parameters of its yield curve control policy in July, effectively allowing yields to rise more freely but capping them at 1%. In a sign that the central bank wants a gradual rise in yields and no sharp moves toward its ceiling, it again intervened during the week to slow the pace of increases, announcing an unscheduled bond-purchase operation.

The yen traded within the upper end of the JPY 149 against the U.S. dollar range, hovering near the JPY 150 threshold that many anticipate could prompt Japanese authorities to step in to stem the yen’s slide. The government again stated that it is prepared to intervene in the currency markets if it detects an excessive swing in exchange rates. If no action is taken, such an excessive swing can cause harm to the real economy as regular people and businesses suffer.
Japan’s rate of inflation slowed in September, with the core consumer price index rising 2.8% year on year, down from 3.1% in August. However, price increases remained above the BoJ’s 2% target for the 18th straight month, and the BoJ is widely expected to revise up its inflation forecasts at its October meeting.

The focus remains on wage growth, where a move higher in pay demands for next year could indicate changing wage-setting behavior and rising confidence that the BoJ is getting closer to its target. The Japanese Trade Union Confederation, an umbrella organization known as Rengo, plans to demand a wage hike of at least 5% in the 2024 “shunto” labor-management talks between unions and companies. The BoJ sees sustained wage growth as key to meeting its inflation target.
China macro data
Stocks in China fell sharply as deepening property sector woes offset optimism about a better-than-expected gross domestic product report. The Shanghai Composite Index declined 3.4% while the blue chip CSI 300 gave up 4.17%, erasing all gains from the reopening rally earlier in the year.
Country Garden, formerly China’s largest property developer, announced that it was unable to meet all its offshore debt payments after it received a 30-day grace period in August. The company’s missed dollar bond interest payment makes it all but certain that it will default on a dollar bond for the first time and highlighted the troubles China’s real estate market faces.

Concerns about China’s property market outweighed a surprisingly strong gross domestic product release, which showed that China’s economy expanded an above-forecast 4.9% in the third quarter over a year earlier, slowing from the 6.3% rise recorded in the second quarter. On a quarterly basis, the economy grew 1.3%, up from the second quarter’s 0.5% expansion. Quarterly readings provide a better reflection of underlying growth in China than comparisons over a year ago, when major cities were under pandemic lockdown.

Retail sales rose a better-than-expected 5.5% in September from a year earlier, up from 4.6% in August. Industrial production growth was unchanged from August, while urban unemployment fell slightly.

China’s central bank injected $100.2 BILLION into their lending market on Friday. On Monday, China made the largest injection on record of one-year policy loans on Monday. This comes after China unexpectedly implemented their biggest rate cut since 2020. China also cut rates on $6 trillion of mortgages. All as a bank run began at the Bank of Cangzhou on fears that the collapse of Evergrande made them insolvent.

Crypto News
=> FTX clients may receive $9 Billion shortfall claim settlement by mid-2024.
FTX's debtors have reached an agreement that could lead to a $9 billion settlement for FTX clients. The deal involves the Ad Hoc Committee of Non-US Customers, the Unsecured Creditors Committee, and class action plaintiffs. If approved by the bankruptcy court, this settlement will benefit FTX clients and resolve long-standing customer property disputes.
Under the proposed plan, customers will receive over 90% of the distributable value worldwide. Additionally, eligible customers will have the opportunity to settle preference exposure by reducing their claims or accepting cash payments. This offer aims to ensure fairness among clients.
=> The SEC reveals 2024 examination priorities, with crypto dealer-brokers and transfer agents under target.
The United States Securities and Exchange Commission (SEC) has revealed its examination priorities for fiscal year 2024. The SEC's Division of Examinations is closely monitoring the rapid growth of crypto assets and related investments. They will focus on broker-dealers and advisers introducing new products and innovative practices, as well as transfer agents involved in microcaps and cryptocurrency-related assets.
The examinations will ensure compliance with standards of conduct, especially when advising retail-based and older investors on crypto assets. Additionally, the SEC will review registrants' cybersecurity measures and assess compliance with regulations concerning crypto assets, risk disclosures, and operational resilience.
However, the SEC has yet to provide regulatory clarity for the decentralized asset class, despite engaging in legal disputes with Binance.US and Coinbase.
=> The SEC drops lawsuit against ripple executives Brad Garlinghouse and Chris Larsen.
Ripple's CEO Brad Garlinghouse and Executive Chairman Chris Larsen have been cleared of all charges by the U.S. SEC. The SEC dropped their case with prejudice, marking a significant turn. This is the third victory for Ripple, following a ruling in July 2023 that declared XRP not a security. The SEC's appeal attempt also failed in October.
Interestingly, Brad Garlinghouse called the regulator a "rogue" with a "political agenda." Chris Larsen expressed concern about the lawsuit's origin and motivation. Ripple's business is now 90% international due to regulatory chaos, but it remains committed to responsible innovation in the crypto industry.
=> LBRY shuts down operations.
While Ripple is having a series of victories against the SEC, blockchain publishing platform LBRY Inc. is closing down due to mounting debts. LBRY lost a legal battle with the SEC over an alleged unregistered security sale, and the court ruled in favor of the SEC. The SEC initially demanded $22 million but later reduced it to $111,614 when LBRY couldn't pay.
LBRY's team, executives, employees, and board members resigned, ending an eight-year journey. However, LBRY's open-sourced and decentralized blockchain will continue as long as miners support it.
=> ECB enters ‘preparation phase’ for Digital Euro, aims to finalize rules and select issuers.
=> A UK minister of parliament recently wrote to the Financial Conduct Authority (FCA) urging the regulator to take a softer line on crypto firms as they adjust to the new advertising rules.
=> Australia’s federal government is moving forward with its plans to introduce tighter regulation for crypto exchanges, which will need to apply for a financial services license.
=> US Senator Elizabeth Warren has gathered a group of over 100 senators and members of the House of Representatives to sign a letter that raises questions about crypto financing in the terrorist activities of Hamas and Palestinian Islamic Jihad.
=> Reddit plans to discontinue blockchain-based ‘community points’.
Reddit will be discontinuing its blockchain-based reward system, Community Points, on November 8th, citing scalability challenges. The program, which was initially launched in 2020, aimed to reward users for positive engagement in specific communities. However, the team found it difficult to scale the program across the platform.
As expected, the decision to discontinue Community Points has been met with criticism from some users, particularly from international users who are currently ineligible for the new Contributor Program. Following the announcement, the MOON token, used on the r/Cryptocurrency subreddit, and other related tokens plunged by over 80%. This prompted some users to accuse the team of rug-pulling the community.
=> Binance.Us halts usd withdrawals, instructs users to convert usd to stablecoins.
Cryptocurrency exchange Binance.US has updated its terms of service to remove direct withdrawals in United States dollars.
Users can now only withdraw USD by converting it to stablecoins or other digital assets first. This change comes amid increasing regulatory pressure on the crypto industry and Binance.US has had difficulty maintaining its fiat on-ramps and off-ramps in the past year.
The terms of service update also states that U.S. dollar funds in Binance.US wallets are no longer protected by deposit insurance provided by the Federal Deposit Insurance Corporation (FDIC).
=> Binance announced earlier this week that it will stop accepting new UK users in order to comply with new regulations.
=> Cryptocurrency exchange Upbit has revealed it has received ‘in-principle’ approval from the Monetary Authority of Singapore to offer users digital asset services.
=> Uniswap introduced a 0.15% swap fee for certain tokens within its web application and wallet, marking a shift from the platform's previous no-fee structure.
=> Coinbase’s layer-2 network Base has taken a significant step towards transparency by making its code repositories and smart contracts open-sourced to the public.
=> The newly promoted Tether CEO, Paolo Ardoino, has stated that the stablecoin issuer plans to release real-time data on Tether reserves in 2024 in an effort to boost transparency.
Cryptos: spot, derivatives and “on chain” metrics
It was a rough week for the crypto market, with several negative news stories. LBRY Credits was forced to shut down due to a large loss to the SEC and millions in debt. The Fantom Foundation, a non-profit organization that oversees the Fantom blockchain, was attacked. And Reddit discontinued its blockchain-based community points reward program.
But despite the bad news, the price of Bitcoin rose to as high as $30,171 at one point during the week. It is currently trading at $30550, up 12.50% over the last 7 days, thanks to optimism surrounding the potential approval of a Bitcoin ETF.
There were a few positive stories as well. For instance, the clients of the defunct FTX crypto exchange might receive a $9 billion shortfall claim settlement by mid-2024. And the SEC has successfully dropped lawsuits against top executives at Ripple.
Gainers / Losers last 7 days, block size volume.

Bitcoin
Last week we commented the following: “...The fake news about the approval of the ETF by the SEC caused a brutal spike in the price, managing to break the upper VPOC of $28100 that had been acting as resistance during the last few weeks. The key now is a consolidation above the level, triggering a change in character from what has been seen in recent weeks. Consolidating above this level would be a success for demand and would give rise to an attempt to attack the upper minor selling control established at $30250….”
It appears that demand has taken control and has managed to consolidate the key $28100 level. The next battle to be won by the bulls is to consolidate the minor selling control of $30250. We will be watching for possible shakeouts of the relevant previous highs, washing out those highs is not per se a battle won. We insist that the demand must consolidate and annul the sell initiative zone of $30250. If this happens, the door would open the door to a bullish long term scenario. On the contrary, if the market shakes the previous highs and goes back below $30250, everything will have remained a shakeout and a fake rally.
Bitcoin 17/10/23 4h chart

Bitcoin 23/10/23 4h chart

In a high time frame chart is where we observe the key moment in which we find ourselves. Despite the rise experienced by BTC since November 2022, the bullish imbalance dynamics of the structure marked in green has left a clear weakness, the first imbalance attempt has not been clean and vigorous but has left a failure. After that failure the market has been unable for weeks to break above the VPOC of $28100. It is therefore vital for bulls to conquer $28100 to reverse this poor bullish imbalance.
The market is trying to reverse the weakness of the bullish dynamics. Whether this intermediate structure will be resolved as cumulative or distributive is yet to be determined. This is why we will act calmly, stay away from the FOMO and wait for effective imbalances.
Bitcoin 17/10/23 Daily chart

Bitcoin 23/10/23 Daily chart

Bitcoin’s currently constrained supply and liquidity could also serve to amplify upward moves.
- exchange balances are at levels not seen since 2018.
- smaller entities have been accumulating while whale positions have been declining
- hodlers be hodling (70% of supply has not transacted in 1+ years, 30% in 5+ years. ATHs both.
- and on-exchange BTC volume (in BTC terms) for Sep. 2023 was the lowest month since Dec. 2016


The next several months will be very interesting for Bitcoin, here’s the latest ETF 19b-4 deadlines:

Ethereum
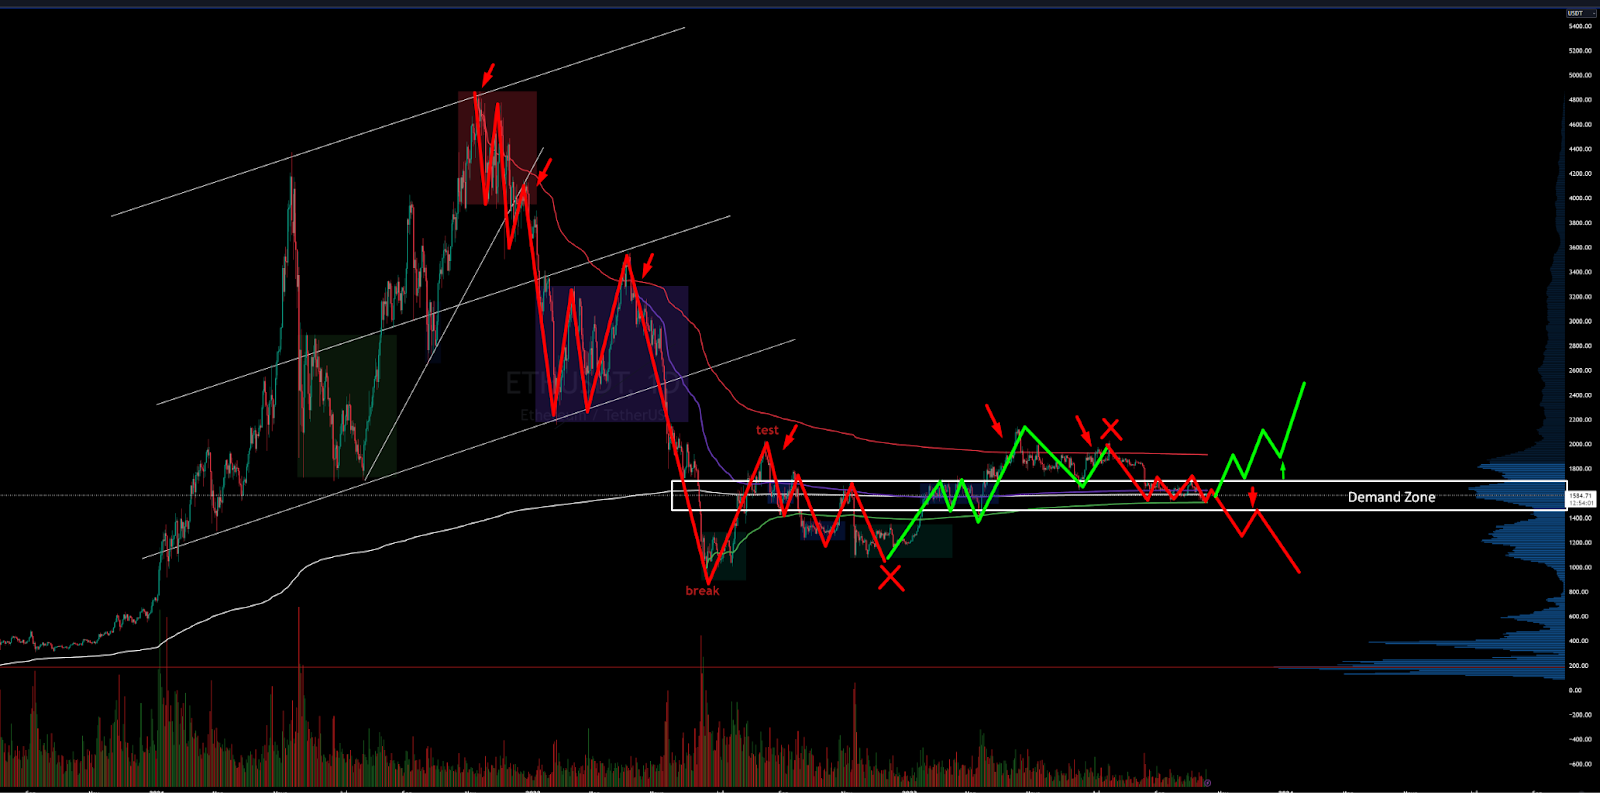
Ethereum has been unresponsive in the demand zone for weeks and is in dire need of catalysts to get moving.
After crashing back into the Vwap anchored at all time highs, the market has returned with vigor to the demand zone between $1700 and $1500. Even with the news of the approval of the ETH futures ETF, the market reaction in the demand area has been quite poor and it's been too many weeks without any reaction from buyers. This zone is key, as the loss of this zone would mean that sellers are back in control.
Consistent long scenarios require seeing price vigorously break out of the demand zone to subsequently conquer the Vwap anchored at all-time highs. The big battle for the bulls lies there, neutralizing that clear selling initiative zone at the Vwap.
Ethereum 17/10/23 4h chart
Ethereum 23/10/23 4h chart

BNB
We will closely monitor the evolution of BNB as a measure of risk perception. BNB is the cryptocurrency coin that powers the BNB Chain ecosystem. BNB is one of the world's most popular utility tokens and it is used primarily to pay transaction and trading fees on the Binance exchange. It is Binance's flagship token.
At first glance we note that the Vwap anchored at highs has never been exceeded or practically tested since late 2021. The vigorousness with which the Vwap anchored at the local lows of June 2022 has been broken through makes us aware of the major weakness on this token.
Clearly, the area to watch is the historical support at $220 and we are already below this level with risk of consolidation and bearish continuations. From there Binance could start to have problems. We believe it is very necessary to follow very closely the evolution of this token, as it could anticipate a new CEX crisis.
BNB 17/10/23 4h chart

BNB 23/10/23 4h chart

Classic markets
Late Thursday, yields on the benchmark 10-year U.S. Treasury note yield briefly topped 5% for the first time since July 2007, though they dropped before Friday's open. Geopolitics also are rattling Wall Street ahead as the Middle East conflict extended to attacks against American targets in the region. U.S. crude oil moved back above $90 per barrel yesterday, a two-week high.
Friday's steep losses tipped the SP500 into negative territory for the month. The SPX is now on pace for the first three-month downturn since January–March 2020. The weakness runs against seasonal trends, as October's been positive for stocks in six of the last nine years, including the last two. AI darling Nvidia experienced its worst week since September 2022, down over -8% Tesla wrapped up the week with a -15% loss, its worst week of the year.
As stocks fell, volatility popped. The Cboe Volatility index (VIX) climbed above 21 for the first time since early May, suggesting the SPX could experience sharper moves.


The market lacks positive catalysts, such as progress toward a resolution of the Middle East conflict, traction on Capitol Hill before a possible government shutdown, or spirited earnings results and guidance from major info-tech firms next week.


Q3 Earnings season
Markets are gearing up for an eventful week of corporate earnings. We’ll get reports from big tech companies including Microsoft, Meta Platforms, Amazon, and Google-parent Alphabet. Other prominent companies such as Visa, Mastercard, Verizon, Boeing, GE, Ford, General Motors, Spotify, Snap, IBM, Intel, ExxonMobil, and Chevron will also report earnings.
Since October 3, earnings estimates for the third quarter have fallen by 0.6%, and for the fourth quarter, they have fallen by almost 1.3%. This seems like a material drop in earnings estimates, considering that just 86 out of 499 companies in the index have reported results thus far.

This has resulted in first-quarter 2024 earnings estimates dropping by 0.3% and second-quarter earnings estimates dropping by 0.1%. Certainly, these are not large drops at this point for 2024, but if earnings for 2024 start to trend lower with 2023 earnings estimates, that poses a serious problem for the SPX because this is not a cheap market.
This is likely why earnings estimates for the third and fourth quarters are coming down, based on the early rounds of data; when sales grow faster than earnings, it is a sign of margin compression. If margins are compressing, then it probably means that estimates for all of 2023 and 2024 will need to be adjusted, and there is a good chance the index either doesn't see 11% earnings growth next year or that the 11% earnings growth comes off a lower level of overall earnings in 2023.

Why would an investor pay 19.3 times 2023 earnings estimates, or 17.5 times 2024 earnings estimates, when the 2-year Treasury rate is paying a "risk-free" rate of 5.1%, or the 10-year Treasury pays almost 5%, compared to the earnings yield of the S&P 500 of 5.05% in 2023 or 5.69% in 2024. It doesn't make much sense, especially when the risk is that earnings estimates may be too high and need to be adjusted lower, meaning the earning yields go higher and the SPY drops.

If earnings estimates for the third and fourth quarters continue to sink, the SP500 will sink with them because there will be nothing left of the bull narrative to support stock prices.
Treasuries worst drawdown in history
This is the sharpest drawdown Treasury bonds have EVER experienced. 20-year Treasury bond ETF (TLT) was at $170 in August 2020. Today, TLT is hovering around $83, a level unseen since May 2006, prior to the Financial Crisis. To put this into perspective, TLT has experienced a drawdown of more than 51% since the highs in August 2020.


The recent drawdown in treasuries is the worst in recorded history, and even almost on par with the drawdowns in Bitcoin. Corporate bonds have also taken a beating, but mostly due to the effect of rising interest rates as credit spreads slumber. The growing consensus among fund managers and strategists is that longer-term bond yields will be lower next year. Macro (PMIs) and intermarket indicators (copper/gold) affirm that view. Rising interest rates are presenting headwinds to real estate and risk assets, prompting the question whether the cure for higher rates will be: higher rates...
We are living through the most persistent rise in yields of the past half century, and it’s probably going to have to take some sort of exogenous shock or crisis to derail this kind of momentum.

For 10-year treasuries this has been the worst drawdown in history in nominal terms (albeit not quite so in real terms as the dual inflation shocks of the 70’s set a high (low?) bar).

Investment Grade corporate bonds have also seen significant drawdowns, but this has primarily been a duration thing, i.e. a consequence of rising interest rates pushing down the price of bonds. The credit side of things has been completely contained so far in the scheme of things (compare and contrast to 2020 and 2008/09, where the losses were driven by credit risk; large spikes in credit spreads.

The ZEW survey respondents are increasingly pounding the table on their call that US longer term rates are headed lower. They have historically had a decent track record, so there is an element of “wisdom of the crowds” going on here, but equally it is an increasingly consensus viewpoint…


One of the best intermarket indicators for US 10-year bond yields over the previous decade has been the copper vs gold ratio. The reason is that copper is basically a proxy for global economic activity, while gold is a proxy for risk sentiment. So in a downturn gold goes up, copper goes down, the ratio of copper to gold goes down and so do bond yields (which are likewise determined by the economic pulse and risk sentiment). But that correlation seems to be suffering from long covid. The Pandemic supply + stimulus shocks may have broken the correlation by anchoring inflation expectations higher.

Another example of an infirm correlation is the US 10-year yield vs developed market manufacturing PMIs. This and the previous chart arguably give a certain element of evidence to suggest that bond yields head lower, or at least that they will head lower in the event of a recession.
It is interesting to reflect on the period immediately after the pandemic crash, where it took bond yields quite a while to catch-up to the PMIs (maybe we can at least partly blame this on QE?). And it does raise a question as to whether this is simply the “Wile E. Coyote Effect”, and that bond yields will drop down to meet the PMIs.
Confounding factors though include the influence of QT, higher government debt loads (concerns around fiscal sustainability), ghosts of inflation, and maybe even inventory cycle and base effects messing up the PMI signal.

Those who were around in the pre-pandemic years, especially 2014-17, will remember there was the “Search For Yield” theme, where cash rates were basically zero, and bond yields bouncing along the bottom. Investors were searching for yield by reaching out to longer duration bonds or taking on greater credit (or equity) risk. But now? Cash provides greater yield than many of the traditional yield oriented assets and without any of the same credit/equity/interest rate risk. And hence now the level of interest rates is a headwind vs previous tailwind to income assets.

The SP500 of today resembles that of 2000 to 2003
The new "bull market" in the SP500 is either over or close to being over. It was never a new bull market but rather the greatest bear market rally in history.
The period between 2000 and 2003 was a pretty brutal time to be an investor, with four rallies of 20% or more in the SP 500, and to add insult to injury, on the fifth rally greater than 20%, the market stalled out from June 2003 until August 2003, as investors waited patiently to find out if they were being set up for another drop.

The message here is that a rally of 20% is relatively common in a bear market, and these rallies always get investors to believe that the worst is behind them. It may be different this time, but it is also clear that the SP500 is now on the cusp of falling below the 20% threshold many investors have used to mark the "new bull market."

Additionally, we are now seeing the yield curve re-steepen as measured by the US 30-year minus the US 3-month. To make this easy, if you reverse the spread and instead do the US 3-month Treasury minus the 30-year, it becomes easier to see that stocks were falling in 2000 as the yield curve was falling, too, as the bond market anticipated a potential recession. If the yield curve continues to steepen today, the relationship would suggest that the stock market declines still lie in front of us, and the rally of last year's lows is either to be re-tested or even broken at some point. This didn't happen in 2020, and it could have been an outlier due to the tremendous liquidity pumped into the economy and the market.


Multiple expansion was also a common characteristic between 2000 to 2003 and today. The big rallies in the SP500 of greater than 20% typically came due to rising PE ratios, which is very similar to what we have seen in recent months. Notably, we have witnessed PE multiple in the SP500 turn lower around the same point in the cycle they turned down in 2002.

That shift in trend and move lower in the PE ratio in the 2000 cycle was accompanied by a move higher in credit spreads, as noted by the Bloomberg High Yield OAS Index. This shows the spread moving sharply higher in the middle of 2002, which caused the SP500 PE to drop from around 21 to around 15.
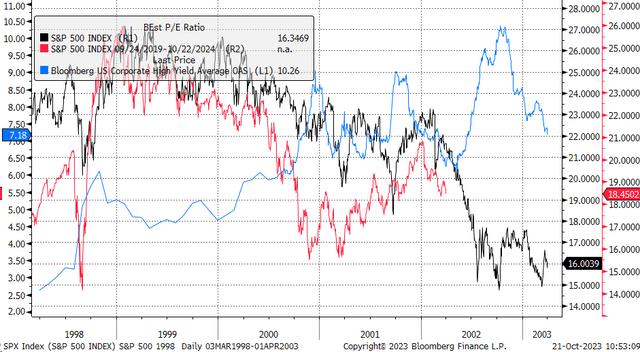
It leaves us at the same part of the cycle because today, as we are starting to show signs of credit spreads widening, with the Bloomberg High Yield OAS on the rise in recent weeks, as yields on the Treasury curve spike, it is only natural for high yield debt also to see their yields rise and spreads widen.

The falling credit spreads in mid-May until July 2023 helped fuel the multiple expansion in the equity market, pushing prices higher and suppressing implied volatility. If spreads are now rising and financial conditions are tightening, then PE multiples should undergo a period of contraction.

One of the biggest drivers of financial conditions and spread seems to be the dollar, as a change in the dollar's value abroad can either contract or expand global growth and with rates on the back of the Treasury curve rising rapidly, the dollar has gone through a period of a lot of strengthening, which should slow growth. At the same time, higher yields also work to slow growth globally and domestically. This should increase the risk of default and cause investors to want a more significant discount to own high-yield debt, thus pushing up high-yield rates and widening credit spreads.

If the dollar continues to strengthen and rates stay elevated or go higher, then high yield spreads should continue to rise, increasing implied volatility in the equity market and, consequently, contract the PE ratio and push stock values down.

The reasons for the decline from 2000 to 2003 may differ, but that cycle taught us that not every stock market sell-off results in a "V" shape recovery, as many investors have gotten used to over the years. These cycles can play out over a few years and often fool people. Many investors still want to buy the dip, which may be the most evident sign that the bear market isn't over. And that this new "bull market" may turn out to be fake, just like all of those in the 2000 to 2003 cycle.
Metrics and ratios
There’s a record level of concentration in the magnificent seven, which make up almost 30% of the SP500. Put another way, if you invest $1 in the market cap weighted SP500 index, you have about 30 cents of it going to just 7 stocks and another 493 competing for the other 70 cents.

Hedge funds concentration in the Big 7, as % of total US single stock net exposure, is still near record highs. Hedge Funds are short everything and long Mag7. This is what is preventing the market from bottoming and why we didn’t think first week of October 2022 was A bottom but not THE bottom.

These seven stocks are an even larger part of the NASDAQ 100, over 43%! Often during times of rising and falling liquidity the NASDAQ has a positive correlation with other longer duration assets, like 30-year Treasury bonds. That correlation has broken down of late, mostly due to the Magnificent 7.

The IWC/GLD ratio confirms that the SPX will make a new low and we do not rule out that it will be before the end of the year.

Curve bear steepening opens the door to VIX rallies

Fixed-income markets are beginning to rotate

Market comment
After one of the longest stretches below 20 in the past 5 years, the VIX finally broke higher as Powell's semi-hawkish words failed to drive comfort into the long end of the bond market and the SP500 turned lower as morning weakness, largely on the back of Tesla's miss, turned into a broader sell-off by Friday afternoon.

VIX Expiration landed on Wednesday AM at 9:30 ET, and VIX immediately ratcheted higher, with equities sliding to 4300. Powell failed to talk down rates, which provided the final leg higher in VIX/leg lower in SPX <4,300. We now have the US 10Y at major 10+ year highs, with the VIX matching at recent highs.

The hope for a Christmas rally and even a visit to all time highs is still alive. The feeling of denial and hypnosis of a good part of investors is reflected in the two charts below. We strongly advise the reader not to approach the markets as if they were a game of prognostication, ego and methodologies that have no basis at all. On the contrary, we call for deep reflection taking into account the geopolitical and macroeconomic context. From the point of view of price dynamics around the value areas, the situation is now greatly complicated by the bulls. It is not a question of how far it has come, but the way the market has come.


After the December 2021 all time highs, the market began a thick and overlapping corrective process during 2022, reaching a floor in October 2022. It is clearly seen how all this corrective congestion resulted in a value area, which has attempted a bullish imbalance that is in the process of failure.
If the market loses the volume point of control (4150 VPOC) this will imply that this entire value area will rotate to distributive, leaving the rally started in October 2022 as a failed bullish attempt to test all time highs. We repeat that what is really dangerous is the way the market has gotten to where we are, with metrics that even exceed those seen in the year 2000 and with a market completely dominated by systematic "price agnostic" flows and with an exhausted and overcrowded short vol and long tech trade.

In terms of lower timeframe price dynamics, the situation is what it is, the market has been trying to defend itself from losing the upper control zone, coinciding with the June VPOC. The market's defense to capitulation is reflected in the structure marked in gray, however, demand has been unable to unbalance to the upside, conquering the June VPOC and the VWAPS shown on the screen.
Last week we commented the following: “...We believe that short squeeze and crunch to volatility dynamics are no longer enough to maintain the upward path and we really believe that the market is in agony and is spending all its bullets to sustain itself. Of course we could be wrong, in which case a recapture of the June VPoc and green VWAp will change our bias radically…”
And so it has been, “short squeeze and crunch vol” have not been enough to reverse the evident situation of weakness in which the market finds itself. After the failure of the bullish imbalance of the gray structure and the loss of all buyer controls, the most logical path for the market is to go in search of the trading area generated between April and May of this year.
17/10/23 SP500 4h chart. Big picture

23/10/23 SP500 4h chart. Big picture

Gamma
Dealers are clearly in negative gamma, but the key risk remains market participants suddenly deciding that they're sold puts south of 4150 leave them under hedged to a renewal of the bear market. Dealers are fine (for now), but attempts to hedge an already flagging market could drive implied vol rapidly higher.

The significance of market gamma is not as simple as "bearish or bullish" given that negative gamma is a high-probability predictor of increased realized volatility. However, a historical record shows that negative gamma (days with red dots) fully dominates deep market corrections and bear markets.

Note that the 10d put implied correlation remains low, but has been rising rapidly. A breakout here suggests a regime shift.

Evaluating what just happened on Friday, which was the monthly opex (options expiration), a fair amount of put gamma was modeled to expire. In isolation, the general implications of that would be a higher positive market gamma reading. However, Friday was met with heavy bearish put flows: Equities sunk into deeper territory where the 4200 (420 SPY) Put Wall will have received strong inflows of new put OI.


After the OPEX, the market gamma profile is predisposed as very bearish, with a strong increase of gamma in the 4100 and 4000 strikes. The need to replace expiring protection is less than on quarterly expiry, but we anticipate a new non-quarterly record as the "peculiarly" dangerous month of November approaches.
Gamma Profile 17/10/23

Gamma Profile 23/10/23. Post OPEX