.png)


.png)
This was a choppy week because of all the macro data releases and the start of earnings season. We saw both PPI and CPI come in hotter than expected. While the PPI was shrugged off by the markets, the Headline CPI coming in higher didn't go unnoticed. To add to that, war escalating in the Middle East put markets into a further into risk-off mode. We had a solid set of earnings come out of the banks on Friday, which did attempt to push the market higher but, not for long. Not even options Friday, could keep the markets from closing lower.
The major U.S. stock indexes started the week on a positive note but turned negative on Thursday and Friday as earnings season got under way. The SP 500 and the Dow posted fractional weekly gains while the Nasdaq fell slightly. The Russell 2000 Index lagged its large-cap peers, declining around 1.5% for the week. The latest result extended small caps’ year-to-date underperformance, leaving the Russell 2000 down about 1% so far in 2023. The index has fallen about 14% from its year-to-date peak on July 31. The prospect of a widening war in the Middle East following last weekend’s Hamas attacks against Israel boosted energy shares and defense stocks while weighing on airlines and cruise operators.
Yields of U.S. government bonds modestly retreated as the 10-year Treasury yield snapped a string of five consecutive weekly gains. Even with the weekly pullback, Friday’s 10-year yield of around 4.63% remained the highest since mid-2007 and far above a year-to-date low of 3.29% in early April.
What has changed this week, and with the danger that comes with it, is volatility. In recent days it has been more difficult to keep the ball under water, and that is because the Vol Control Funds can't press the accelerator. Friday's drop in the SPX was dwarfed by the rise in the VIX. We have the set-up to see 2%-3% declines in the large-cap and there are catalysts to bore us.
Investors will aim to look through the fog of war headlines next week to recalibrate as economic and earnings releases pour in. The U.S. retail sales for September are forecast to show a small increase in the core rate from August, while reports on industrial production and housing starts are also anticipated to show incremental month-over-month gains. Those reports will be followed by a key speech by Federal Reserve Chairman Jerome Powell on October 19 as the blackout period for Fed speakers ahead of the next FOMC meeting rapidly approaches.
The Q3 earnings season also kicks into high gear next week, with Tesla leading the charge. Other earnings reporters with the potential to shake up their respective sectors include Procter & Gamble, Johnson & Johnson (preview), AT&T, Netflix, Bank of America, and Taiwan Semiconductor.
In the background of the Israel-Palestine war, crypto was acting last week as a contrary asset and is finally seeing a small bounce after several days of downward price action.Asset management behemoth Fidelity recently published a report highlighting the superiority of Bitcoin over all other digital assets.Caroline Ellison, the former CEO of Alameda Research, has made explosive claims that Sam Bankman-Fried plotted to manipulate Bitcoin prices and keep it under the $20,000 mark. Paul Tudor Jones, a legend in investing circles, said on Tuesday that in the midst of the alarming US fiscal position, he favored having Bitcoin and gold in his portfolio.
This Monday, the storm began with cryptocurrency media outlet Cointelegraph publishing the purported news of the SEC's approval. This claim was further amplified on social media. However, reality painted a different picture. BlackRock was quick to debunk the rumors, confirming that its ETF application remained under review. The report helped to contribute to roughly $182.5 million worth of liquidations over the past 24 hours.
Following misleading reports claiming the U.S. Securities and Exchange Commission's (SEC) approval of a spot Bitcoin ETF from BlackRock, the SEC swiftly responded with a pointed reminder about the reliability of online information. The agency's message states: "Careful what you read on the internet. The best source of information about the SEC is the SEC." This obviously may have long-term consequences of such episodes, suggesting that they could provide the SEC with grounds to deny Bitcoin ETF applications.
Macro y news
Economic Calendar:

Upcoming relevant events:
OCTOBER
▪️27: US PCE
NOVEMBER
▪️1: FOMC
▪️3: Employment report
▪️14: US CPI
▪️30: US PCE
Earnings for next week:

U.S Macro data
The Wednesday release of the minutes from the Fed’s September policy meeting seemed to confirm the shift in official thinking because of higher yields. In particular, while “all agreed that rates should stay restrictive for some time,” officials also agreed that the “Fed should shift communications from how high to raise rates to how long to hold rates." By the end of the week, federal funds futures were pricing in only a 5.7% chance of a rate hike at the next Fed meeting in November versus 27.1% the previous week, according to the CME FedWatch Tool.

Slightly hotter-than-expected inflation readings did not seem to sway investor expectations for the Fed’s next move, perhaps due to expectations that officials might also weigh the added uncertainty from the war between Hamas and Israel. On Wednesday, the Labor Department reported that core (excluding food and energy) producer prices rose 0.3% in September, a tick above expectations. The surprise 2.7% increase in year-over-year core producer prices was the highest level since May, however, due to a significant upward revision in the previous month.

Thursday’s monthly U.S. Consumer Price Index report showed little change in inflation, although underlying categories that feed into the overall CPI number headed in different directions. September’s overall annual figure of 3.7% was the same as the previous month, but housing and energy expenses rose while food costs slipped.

Eurozone macro data
The minutes of the European Central Bank’s (ECB) September meeting revealed that “a solid majority” of policymakers voted to raise the key deposit rate to a record high of 4.0%. The decision appeared to be a close call, given the “considerable uncertainty.” Pausing the rate increases “risked being interpreted as a weakening of the ECB’s determination, especially at a time when headline and core inflation was still above 5%,” the minutes said.
The German government joined a string of other forecasters and sharply lowered its outlook for the country’s economy this year. According to this updated view, the economy is now projected to shrink by 0.4% due to higher energy prices and weaker demand from major markets like China. Estimates released in April had called for Germany’s economy to grow by 0.4%. The Economy Ministry said it expects economic growth to pick up at the start of next year and then accelerate amid a recovery in consumer demand, although, to be honest, it's very hard to believe.
Final inflation readings from Germany didn't surprise markets, both HICP and CPI readings came in line with expectations and previous reading.
Germany HICP: 4,3% vs 4,3% exp and 4,3% previously (0,2% m/m - in line with exp. and previous reading)
Germany CPI: 4,5% vs 4,5% exp and 4,5% previously (0,3% m/m n line with exp. and previous reading)

Data released earlier Friday showed that French CPI rose 4.9% annually in September, while the Spanish equivalent climbed 3.5% on the year.These figures were in line with expectations, and suggest the European Central Bank will keep interest rates at an elevated level for some time given consumer prices remain considerably above the ECB's medium-term target.
Europe's services sector has plummeted. Reaching levels seen only 2 times in the past 15 years: 2008 and 2011.

UK macro data
The UK economy bounced back in August thanks to growth in professional services and education. Gross domestic product (GDP) expanded 0.2% sequentially after contracting 0.6% in July. But the data also showed that construction and production fell.

Japan macro data
The yen weakened to around JPY 149.6 against the U.S. dollar, from about JPY149.2 the prior week, despite seeing some support from investor demand for safe-haven currencies amid the violent developments in the Middle East. While Japanese authorities have repeatedly stressed that they would act against excess currency volatility, without ruling out any options, there has been no evidence that they have recently intervened to stem the yen’s slide.

The yield on the 10-year Japanese government bond (JGB) fell to 0.76%, from 0.80% at the end of the previous week. Speculation was ongoing about when the Bank of Japan (BoJ) could further normalize its monetary policy, having tweaked its approach to yield curve control (YCC) in July to effectively allow yields to rise more freely, but capping them at 1.0%. Asahi Noguchi, a BoJ Board member, indicated during the week that the central bank has room to maneuver before the JGB yield hits its ceiling and that there is no pressing need to alter its YCC policy.

In its October World Economic Outlook, published during the week, the International Monetary Fund (IMF) revised up its forecast for Japan’s growth in 2023 to 2.0% from 1.4% previously. The international organization expects a range of factors, including pent-up demand, rebounding inbound tourism, accommodative monetary policy, and easing supply chain constraints boosting auto exports,to support expansion.
The IMF also lifted its forecast for Japan’s price gains, anticipating that consumer inflation will tick up 3.2% this year, up from a previously expected 2.7% rise. The BoJ is likely to raise its own inflation forecasts in October, as broader-than-expected price hikes, rising crude oil prices, and yen depreciation have exerted upward pressure on prices.

China macro data
Financial markets in China declined in the first full week of trading after the Golden Week holiday, as softer inflation and trade data renewed concerns that the economy may slip back into deflation. China’s CPI remained unchanged in September from a year earlier, following August’s 0.1% rise, largely due to weaker food prices. Producer prices fell an above-consensus 2.5% from a year ago but eased from the 3% drop the previous month.

Meanwhile, trade and lending data came in above expectations but remained weak. Overseas exports fell 6.2% in September from a year earlier, slower than the 8.8% drop in August. Imports also shrank by 6.2%, better than the 7.3% contraction in August and marking the seventh straight month of declines.

In regulatory news, the China Securities Regulatory Commission (CSRC) announced a ban on domestic brokerages and their overseas units from accepting new mainland clients for offshore trading. Any new investments made by existing clients are to also be “strictly monitored,” according to the statement released on Thursday. In another sign that Beijing is ramping up measures to shore up China’s stock markets, financial regulators, including the CSRC, submitted a plan to launch a state-backed stabilization fund, Bloomberg reported.
Crypto News
=> The U.S. SEC does not plan to appeal the decision in the Grayscale case, boosting the chances of the Grayscale Bitcoin Trust turning into an ETF.
=> Lawsuit against SBF continues with more interesting pieces of evidence.
Sam Bankman-Fried, the former executive of FTX, is facing a difficult situation as his criminal trial continues. He is facing seven federal fraud and money laundering charges, which come after the collapse of his crypto exchange FTX and hedge fund Alameda Research.
Bankman-Fried's inner circle at FTX has made plea deals, while other legal proceedings surround FTX's bankruptcy. This week, the key witness was Caroline Ellison, the former CEO of Alameda Research and ex-girlfriend of SBF.
Caroline Ellison, the former CEO of Alameda Research, has made explosive claims that Sam Bankman-Fried plotted to manipulate Bitcoin prices and keep it under the $20,000 mark.
Ellison testified that Alameda was allowed to take unlimited loans from FTX's customer funds, that Bankman-Fried used funds for political donations, that he failed to secure investment from Saudi Arabia, that he had ambitions of becoming the president of the United States, and that he bribed Chinese officials.
=> Cryptocurrency exchange Binance said on Monday it will stop accepting new customers in the United Kingdom, in compliance with new regulation restricting promotions from overseas digital asset firms in the country.
The country's tough stance comes as cryptocurrency regulation remains in focus around the world after a string of high-profile collapses last year sparked worries about how these firms use and store customer deposits in a largely unregulated industry.
=> A Brazilian congressional committee recommends the indictment of Binance CEO Changpeng Zhao and local executives for unauthorized financial activity. They face allegations of fraudulent management practices, offering unauthorized securities trading, and evading compliance with the law.
The committee suggests an investigation into Binance's operations, focusing on tax evasion and money laundering. Binance is also under scrutiny for continuing to offer derivative products despite warnings. The recommendations are not legally binding. The crypto exchange denies wrongdoing but faces mounting regulatory challenges in various countries, including the United States. The report's impact remains uncertain.
=> Binance is stepping up its game with the introduction of copy trading for futures in select markets. This new feature allows users to mimic the trading strategies of experienced traders, promoting a more interactive trading environment.
=> The UK's financial regulator, the FCA, took action by adding 143 crypto exchanges to its warning list, including Huobi-owned HTX and KuCoin. The warning list tells customers to steer clear of these firms.
In the UK, crypto businesses must register with the FCA. However, FCA's Jayson Probin warned illegal promotion could lead to criminal charges. The FCA has approved only 38 out of 291 registration applications since 2020. Currently, only 42 crypto providers are registered, including Bitstamp, Revolut, and Gemini.
=> Crypto broker Genesis has announced that it is halting customer withdrawals, adding more uncertainty to an already tumultuous digital currency landscape.
=> Uniswap launches a mobile ethereum wallet for android users.
Uniswap, the world's largest decentralized crypto exchange, just launched a closed beta of its Android app. This follows their iOS release earlier this year. The Android app streamlines coin selection across different networks, adds security features, and increases transparency regarding transfer fees. While the initial beta attracted 35,000 users within hours, the Uniswap Labs team plans to open-source the code after a security audit. This move marks a significant step in bringing DeFi to a broader audience, emphasizing accessibility and security.
=> Circle, the stablecoin issuer, has launched USDC natively on the Ethereum layer 2 scaling protocol Polygon.
This move allows businesses and developers to create decentralized applications (DApps) with USDC on Polygon, enabling near-instant, low-fee transactions for payments, remittances, trading, borrowing, and lending. Circle plans to enhance liquidity by introducing native USDC, replacing bridged USDC, and fully supporting it. As usual, this offers fast and efficient transactions, always redeemable at a 1:1 ratio for US dollars.
=> Ethereum and multi-chain wallet developer MetaMask has unveiled its latest integration with major payment processor Stripe, allowing users to deposit fiat currency and receive cryptocurrency.
=> Do Kwon-founded Terraform Labs has once again blamed market maker Citadel Securities for its role in an alleged international effort to cause the depegging of its TerraUSD stablecoin.
The real estate-backed USDR stablecoin lost its peg on the 11th of October, falling to $0.53 per coin after the USDR treasury was drained of all its liquid assets.
=> Huobi Global's cryptocurrency exchange, HTX, has successfully recovered the funds stolen by a hacker in late September and has even issued a 250 Ether (ETH) bounty to the individual responsible.
=> Luxury sports car maker Ferrari will now accept cryptocurrency as payment for its cars purchased in the United States and will extend the option to its European customers.
=> Bitmain, a prominent Bitcoin application-specific integrated circuit (ASIC) manufacturer, has reportedly suspended salary payments for its employees starting in September.
=> Tether Appoints Paolo Ardoino as New CEO. Its former CEO, as usual, is not known.
Cryptos: spot, derivatives and “on chain” metrics
The dominance of Bitcoin surged to over 50% last week before falling slightly to 49.8% at the time of writing. BTC price action fluctuated but was able to recover without making new lower lows, while altcoins suffered as traders looked for potential short opportunities. The majority of cryptocurrencies, including Bitcoin (BTC), Ethereum (ETH), BNB, and XRP, have all fallen by at least 2% over the last seven days.
Virtually no gains were posted by any of the top thirty cryptocurrencies last week, but several coins depreciated substantially more than the market leaders this week, including Polygon (MATIC), which fell 8.6% to $0.521054, and Polkadot (DOT), which fell 8% to $3.76. Avalanche (AVAX) crashed hard, shedding 12.4% in seven days to trade at $9.19 on Saturday.
Bitcoin prices have had a volatile start to the US session as cryptocurrency-news platform Cointelegraph broadcasted news that the iShares Bitcoin ETF (BlackRock Group) had been approved. The news saw Bitcoin spike to a session high of $29900 while simultaneously dragging the Crypto markets as a whole higher with Ethereum spiking to around the $1670 mark.
The false post was deleted after nearly 30 minutes but sparked enough interactions to impact prices significantly. Bitcoin has since fallen from $30,000 to $28,000 following skepticism from analysts and reporters. BlackRock confirmed to CoinDesk that the report is false.
CoinGlass data shows that $81 million worth of short positions, or bets against higher prices, were liquidated on the move to $30,000, and $31 million in longs, or bets on higher prices, were liquidated during the correction.
Gainers / Losers last 7 days, block size volume.

Bitcoin
The fake news about the approval of the ETF by the SEC caused a brutal spike in the price, managing to break the upper VPOC of $28100 that had been acting as resistance during the last few weeks. The key now is a consolidation above the level, triggering a change in character from what has been seen in recent weeks. Consolidating above this level would be a success for demand and would give rise to an attempt to attack the upper minor selling control established at $30250. On the other hand, if the market fails to consolidate above $28100, supply would take control, leaving only the blue minor structure's VPOC at $26000 as a buying defense.
Bitcoin 17/10/23 4h chart

In a high time frame chart is where we observe the key moment in which we find ourselves. Despite the rise experienced by BTC since November 2022, the bullish imbalance dynamics of the structure marked in green has left a clear weakness, the first imbalance attempt has not been clean and vigorous but has left a failure. After that failure the market has been unable for weeks to break above the VPOC of $28100. It is therefore vital for bulls to conquer $28100 to reverse this poor bullish imbalance. The Vwap anchored at all time highs continues to act as strong dynamic resistance where the market cannot be hesitating for much longer as the risk of supply taking control and pushing the price into the green range has increased.
Bitcoin 17/10/23 Daily chart

As the reader knows from these weekly newsletters, the possibility of a credit event is on the table. It is interesting in this case to make a comparison of BTC against the Nasdaq and against the credit spreads (HYGH) which in this case of the following chart is inverted. Every time the credit spreads are tightened BTC corrects and in many occasions makes new lows, it is also remarkable how BTC has not accompanied the powerful rise in the Nasdaq since the beginning of the year. Bitcoin as a monetary phenomenon has decoupled from classic risk assets or will it continue to be vulnerable to stresses in classic markets? we will know soon…

Ethereum
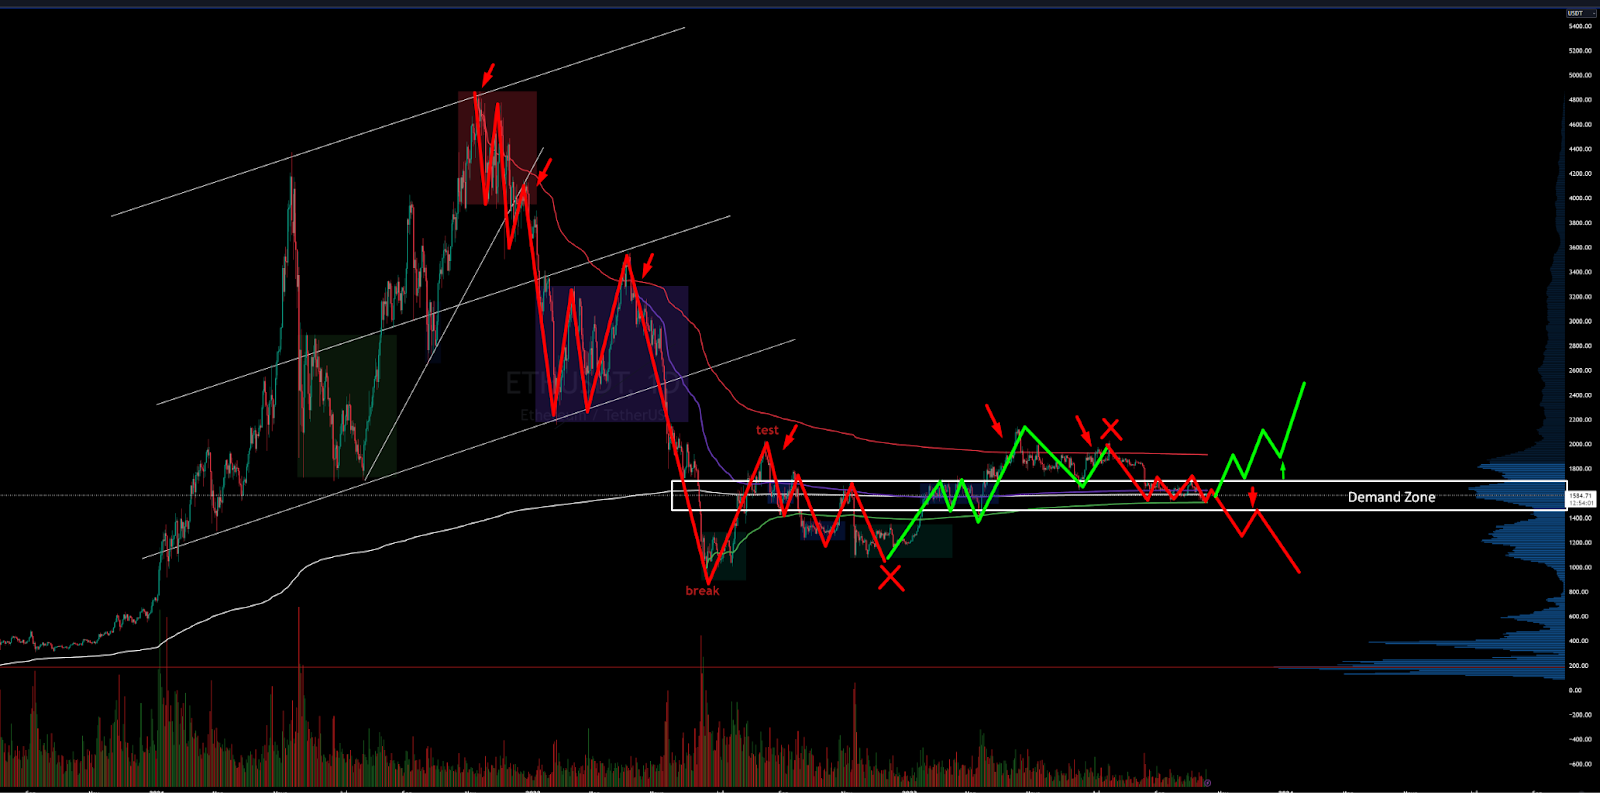
Ethereum has been unresponsive in the demand zone for weeks and is in dire need of catalysts to get moving.
After crashing back into the Vwap anchored at all time highs, the market has returned with vigor to the demand zone between $1700 and $1500. Even with the news of the approval of the ETH futures ETF, the market reaction in the demand area has been quite poor and it's been too many weeks without any reaction from buyers. This zone is key, as the loss of this zone would mean that sellers are back in control.
Consistent long scenarios require seeing price vigorously break out of the demand zone to subsequently conquer the Vwap anchored at all-time highs. The big battle for the bulls lies there, neutralizing that clear selling initiative zone at the Vwap.
Ethereum 09/10/23 4h chart

Ethereum 17/10/23 4h chart
BNB
We will closely monitor the evolution of BNB as a measure of risk perception. BNB is the cryptocurrency coin that powers the BNB Chain ecosystem. BNB is one of the world's most popular utility tokens and it is used primarily to pay transaction and trading fees on the Binance exchange. It is Binance's flagship token.
At first glance we note that the Vwap anchored at highs has never been exceeded or practically tested since late 2021. The vigorousness with which the Vwap anchored at the local lows of June 2022 has been broken through makes us aware of the major weakness on this token.
Clearly, the area to watch is the historical support at $220 and we are already below this level with risk of consolidation and bearish continuations. From there Binance could start to have problems. We believe it is very necessary to follow very closely the evolution of this token, as it could anticipate a new CEX crisis.
BNB 02/10/23 4h chart

BNB 17/10/23 4h chart

Classic markets
Wall Street wrapped up a volatile week with a mixed performance from stocks while investors sought safe-haven assets such as U.S. Treasury bonds and gold, as the Israel-Gaza war looked likely to escalate going into the weekend. Israel's military ordered more than a million people to evacuate Gaza, indicating the start of a ground offensive.
Traders welcomed remarks made Friday by FOMC voting member Patrick Harker, President of the Federal Reserve Bank of Philadelphia, who said he does not expect interest rates will need to be raised further.
Financials eked out gains, amid overall positive sentiment in the sector after the Q3 earnings season was kicked off by reports from JPMorgan, Citigroup and Wells Fargo. Bellwether JPM announced another quarter of record net interest income amid elevated interest rates. The lender also bumped up its full year net interest income guidance. Shares of the Jamie Dimon-led bank rose almost 2%. Wells Fargo also put in a strong net interest income performance, with shares adding ~3%. Citigroup, which delivered revenue growth in its five core units, ended the session with a decline of 0.2%.
Treasury yields were lower on Friday after their big jump in the previous session. The 30-year Treasury yield ended the week at 4.787%, while the 10-year yield closed at 4.62%. The more rate-sensitive 2-year yield was down 2 basis points on Friday to 5.05%.For the week, the Dow Jones posted a 0.8% gain and the S&P 500 added 0.4%, but the tech-focused Nasdaq fell 0.2%.
Crude oil prices spiked this week as a surprise attack by Hamas on Israel led the latter to declare an all-out war on the militant group, with more than 2,800 casualties on both sides. While oil fundamentals have not changed since these attacks, it does not mean they won’t.
Rates don't matter until they matter
Stocks gave back most of their gains from early last week as volatility in interest rates saw credit spreads widen. The inter-market relationship at play currently runs very deep and has everything to do with fluctuations in interest rate volatility. Treasury auctions have become very important parts of the trading day, and last week's auctions were not strong for the 3- and 10-year notes, with the 30-year auction being the weakest. This created a great deal of bond market volatility on top of the hotter-than-expected CPI report.
The Treasury auctions resulted in big intraday reversals in the stock market and were witnessed on Tuesday and Thursday. The S&P 500 saw a sharp intraday reversal following the 3-year auction on Tuesday and the 30-year auction on Thursday. There was even some mild weakness immediately following the 10-year auction.

30-year bond yields experienced the largest basis point spike since March 2020 today, after a failed auction.
On top of this, the large amount of issuances and the sticky nature of inflation are causing the back end of the yield curve to rise. And because the Fed is nearing the end of the rate tightening cycle, the front of the curve remains fairly static, which means the yield curve is bear-steepening, with the back of the curve rising to the front of the curve.

The rise in Treasury rates the past couple of weeks, along with the bond market now starting to show fatigue for the large number of issuances that are coming from the Treasury daily, likely means that the yield curve continues to steepen and is resulting in higher bond market volatility, as represented in the rising MOVE index. As bond market volatility increases, credit spreads widen, leading to stock market declines. At the end of the day, stocks are trading with bonds and credit spreads, and if these spreads continue to widen, stocks will continue to move lower.

If volatility persists in the bond market, stock prices will likely decline. Just how volatile the bond market remains will depend on the strength of the economic data, the path of inflation, continued Treasury auctions, and geopolitical tensions.
At least at this point, the economic data remains robust, and the data suggest the third quarter GDP should come in strong. Meanwhile, the path of inflation has proven to be stickier than the market has forecast, as the last CPI report supported. Additionally, the Treasury shows no sign of easing off the issuance accelerator.
Finally, geopolitical tensions are as high as ever, which may indirectly play into higher rates. Historically, investors tend to associate war and geopolitical tensions with lower rates. But in this case, if the tension results in higher oil prices, it seems highly likely that rates won't go down but instead go up. Because higher oil prices will only result in even higher inflation rates. This would likely catch many investors off-guard and unprepared, especially those who see a fourth-quarter stock rally coming.
Consumption loses steam
While sticky inflation is already an issue, it gets worse as general economic growth is in a bad spot. We’re seeing increasing hints that a recession is nearing. For example, the Animal Spirits Index (“ASI”) experienced a significant decline, dropping from 0.69 in August to 0.1 in September. A value above zero indicates optimism, while a value below zero suggests pessimism. This September's slip marked the largest change in the ASI since March 2020.

.
The ASI is composed of five indicators, including the S&P 500 Index, the Conference Board's Consumer Confidence Index, the yield curve, the VIX Index, and the Economic Policy Uncertainty Index.
According to Wells Fargo, all five components saw a decrease in September, influenced by factors such as financial market downturns and concerns about a potential government shutdown and Fed policy uncertainty. Consumer confidence also took a hit in September. The Consumer Confidence Index saw a notable 5% decline, emphasizing increasing pessimism among consumers. After all, inflation is a major driver of consumer confidence.
Consumer spending is trending lower, with October showing a deeper decline than what we saw during COVID, according to Citigroup. Credit card spending is finally starting to collapse.


Excess savings from 2020 is now depleted with credit card debt crossing $1 trillion and interest on credit cards surpassing 20%.The consumer is in trouble and to make things worse, personal savings rate is at 3.9%.Levels not seen since October 2008.It's not long before consumer-related challenges make headlines.


US small banks’ credit card delinquency rates hit a multi-decade high.

When looking at the bigger picture, we’re not that far away from a scenario where the market may have to price in stagflation. Stagflation is very bad for consumer stocks and most REITs. After all, it would mean that limited pricing power will continue to face elevated inflation while economic contraction hurts the health of tenants.
While the SP 500 is less than 10% below its all-time high, the Vanguard Real Estate ETF (VNQ) is 35% below its high (excluding dividends). Consumer staples (XLP) are 18% below their high.

If the Economy Is So Strong, Why Are Consumer Stocks Tanking?

Credit Contraction is here

In 2023 so far, we have seen a total of 516 corporate bankruptcies. This is roughly double the YTD total in 2022 and ~39% more than the entire 2022 count. We are seeing the exact same level of bankruptcies in 2023 as 2020, when the global economy was shut down. Aside from 2020, we now have the highest YTD total bankruptcy count since 2010. All as interest rates are likely to remain elevated for the entirety of 2024.


Small Business Bankruptcies Rising at Worst Pace Since Pandemic.


It is time to pay special attention to employment


WARN notices suggest that jobless claims will jump this month.

Initial claims continue improving while continued claims are worsening.This looks at the non-seasonal data vs. 2018/2019 to remove all the distortionary effects. This implies there are not many layoffs, but people who do lose a job are having a hard time finding a new one.

Ex-post revisions to employment data can be wild even on jobless claims. In 2007/2008 it already happened and when it was revised it was already clear that the deterioration had started earlier than initially expected.

This tightering has a big impact on businesses that need to borrow, refinance or are dealing with revolving credit lines. Small businesses often fall into one more of these buckets, and as a result a reduction in the availability of credit combined with a rising cost of capital often leads to an increase within initial jobless claims. Particularly if we see JOLTS data show a reduction in job openings, such that it's harder to go from one job the the next.
Jobless claims reaching over 300k week over week combined with a contraction in ISM Services PMI data, where the economy has been most resilient, would be two areas to monitor closely for signs that the economy is starting to slow into a potential contraction.

Full Time employment is down a stunning -692k over just the last 3 months. the last 3 times this happened?? 2001, 2008 and Covid recession (2020). The unemployment rate starts to rally AFTER the yield curve has peaked (we’re getting there) and the stock market bottoms AFTER the unemployment rate rises sharply.

Metrics and ratios
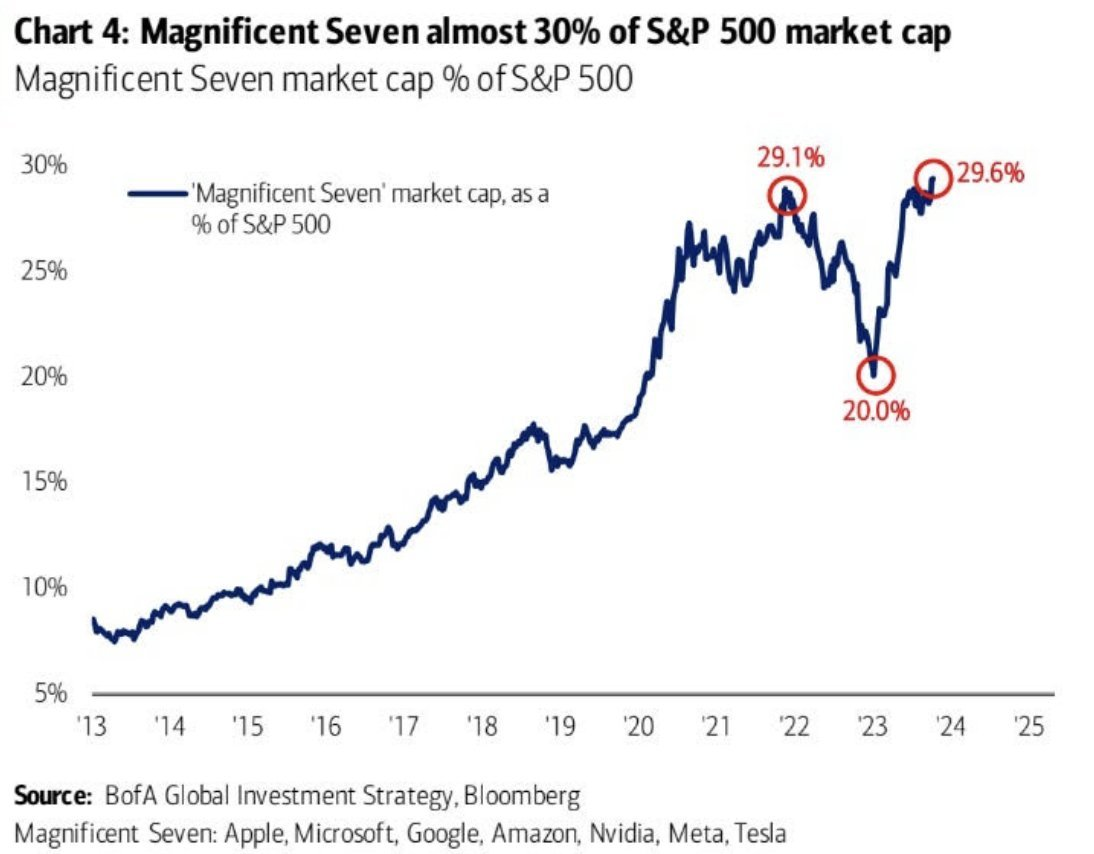
The SP 7, now reflects a record 29.7% of the entire index by market cap. This is up sharply from 20% at the beginning of 2023 and above the 29.1% high in 2021. Meanwhile, the SP 7 is up over 50% and continues to drive market direction. The remaining 493 stocks in the SP 500 are currently up just 3% in 2023. Never has market direction been so driven by just a few stocks which are all technology focused. 7 stocks are holding up the entire stock market and this is the most narrow rally in history, led by the highest price ratios in history.
Unlike bear markets that ended in 2002 and 2009, low in October 2022 hasn't been followed by durable outperformance of SP 500 Equal-Weight relative to cap-weight-version.

Ratio of NASDAQ 100 relative to Russell 2000 has soared beyond its 2020 and 2000 peaks.

Big vs. small caps.

The price ratios of large caps are now the highest they have ever been in relation to the price ratios of small and mid-caps.

Just passed 1-year mark for SP 500’s Oct 2022 low, yet only 2% of members are making new one-year high … vastly different compared to bear markets that ended in 2002 and 2009, when >20% of members were making new highs.

NVDA's share price has increased 9400% across the QE bubble, while its P/S ratio rallied 1300%. This means that if NVDA returned to its historic price ratios, it'd be down over 90% from current levels. NVDA needs to grow over 1000% to justify these price ratios.

Despite SPX being around 3% above its 200-day moving average, only 34.5% of stocks are above their 200-day moving average. Just another visualization of how narrow this rally has been.

The Nasdaq 100 is seeing one of its largest ever divergences from the advance/decline line, which sits just barely above the 2022 low.

Normally:
- The yield curve tops
- The market tops
- The yield curve declines sharply
- Equities follow


Market comment
Much has happened over the past week. Two Fridays ago, the market ended a correction that it has been in since it cracked after the loss of heavy call gamma from September’s Triple Witching on the 15th. This downward trajectory ended when the market rallied on bad news from an economic announcement, with a significantly hotter-than-expected NFP. This initiated a squeeze.
Then, over the weekend, war broke out in Israel and the market gapped down with heavy short selling. However, the pain trade was up, and the market continued to squeeze until we teased into positive gamma territory. On Thursday, we lost positive market gamma, and bearish waves led to a drop after a surprise spike in 30-year yields in direct response to a shocking Treasury auction, which sent us deeper into negative gamma territory. And then on Friday, the bearish options flows continued as the index price glided down cleanly.
The market left for the weekend with a lot of fear in the body. So why the sudden rush to hedge on Friday? That’s because the one thing that keeps traders awake at night is gap risk. And there’s no greater gap risk than during a weekend when there’s war. But here’s the odd thing: Even though the VIX was flying on Friday, the S&P hardly budged. It’s possible that news-insensitive CTA buying helped the market stay afloat despite the panic in volatility markets. Not to mention, looking at how poorly the Nasdaq performed, we also saw a rotation from riskier tech stocks into more defensive plays like healthcare and utilities.
Despite the big spike on Friday, the Vix fell short of clearing the October 4, 5-month high of 20.88. However, even though the gauge topped out at 19.88, the VVIX (Vix Volatility Index) closed the week at 108.10, the highest level since the banking crisis in March, indicating that demand for Vix calls is at a 7-month high.

When implied volatility moves sharply higher in a short space of time, equities need to react lower, quickly, or implied volatility falls. When implied volatility falls, it creates mechanical buying in stocks. And so it was at the start of this week after a weekend with no major developments on the geopolitical front. However, the market has entered into a dynamic of living by the day, moving through internal positioning dynamics that are squeezed. This is not a genuine bull market, but a market that is resisting the inevitable, trying to create its own reality outside of its own environment.
If the Vix takes out the recent highs of 20.88, it would suggest new (bearish) information has arrived, triggering a clear sell-signal for the SP500.
Dealer gamma was pulled back to neutral by the vol selloff/equity market rally. We are sitting comfortably in the middle of an ocean of option liquidity. The bears are polar bears trapped on shrinking ice flows. The bulls have an opportunity for Opex, if they manage to overcome the 4400 gamma call, a conquest of that level would open the door for further rises. However, all this has little to do with what is needed to reverse the weak market situation in recent weeks.

In terms of high timeframe price dynamics, the situation is really interesting. The market is fighting not to imbalance to the downside the entire upper value area, whose control is at the June VPOC, 4415 points. This defense is reflected in the lower value area marked in gray, which is clearly struggling to imbalance to the upside. The June VPOC, the VWAP anchored at highs (green) and the VWAP anchored at previous relevant lows (red) are acting as clear resistance.
We believe that short squeeze and crunch to volatility dynamics are no longer enough to maintain the upward path and we really believe that the market is in agony and spending all its bullets to sustain itself. Of course we could be wrong, in which case a recapture of the June VPoc and green VWAp will change our bias radically.
09/10/23 SP500 4h chart. Big picture

17/10/23 SP500 4h chart. Big picture

Let's move down the timeframe to study this area of minor gray value.
Demand is having real problems to imbalance to the upside, and even more so considering the nature of the movements. First bullish imbalance failure with a return to value, where demand has responded again, leaving the door open for a second bullish imbalance failure.
The upper minor seller control has been established as an important sell initiative zone coinciding with the gamma call at 4400. This is the area to be conquered by demand, which is suffering from clearly weak dynamics. On the short side any loss of the major buying control would open the door to a total failure of the demand to progress upwards in a critical zone and would force us to look at higher time frame charts.

Gamma
From a Gamma profile point of view, it is well established that the bulls have to conquer 4400 and the bears have to break 4300 for the selling torrent to enter. The war is on for OPEX.
Gamma Profile 09/10/23

Gamma Profile 17/10/23

From Tier1 Alpha
Yesterday's move pushed the 1-month realized vol back above the 13 handle, prompting vol control funds to sell around $10 billion in equities. While this selling pressure clearly wasn't felt in the tape, it's still an example of how even upside volatility can cause risk-based strategies to sell.

This is something we spend a lot of time focusing on because we believe this dynamic is what drives the directional component of volatility instead of solely amplifying returns. Since dealers started the day off in negative gamma, as the market started to rally, they were forced to buy into the strength, pushing the index up well over 1%. This led to an increase in realized volatility levels, which in turn prompted vol control funds to sell. Remember, upside volatility is STILL volatility!

Although this has resulted in a minor deviation in our systematic positioning index, the overall trend and direction have remained consistent with our expectations. We acknowledge that these flows are not the sole determinant of market dynamics, but we do regard them as one of the most influential factors driving market trends in recent years.

The significance of these flows has continued to become more prevalent, especially in the context of an inelastic market driven by a rise in passive indexation. This shift has made markets less flexible due to strict allocation mandates, which, in turn, has led to an amplified impact of flows entering or exiting the system.


