.png)


.png)
What an incredible week ! surely the most intense and crazy of the year.
The U.S. Federal Reserve again kept interest rates unchanged, but at the highest level since 2001, while not foreclosing the possibility of approving another rate hike at its mid-December meeting. The central bank has now held rates steady for two meetings in a row, marking the longest period without an increase since the Fed began to lift rates from a near-zero level in March 2022.
A shift in the U.S. interest-rate outlook triggered big weekly moves in the bond market, as yields of U.S. Treasuries fell, interrupting the trend of sharply rising yields seen over the past seven months. The yield of the 10-year U.S. Treasury bonds fell to 4.52% on Friday, down from 4.83% the previous week; the 2- and 10-year yields fell well below their roughly 5.00% levels of the previous week.
U.S. stock indexes posted their biggest weekly gains of 2023, reversing course just a week after the SP500 and the Nasdaq entered correction territory following recent declines. The Nasdaq surged 6.6%, the SP500 added 5.9%, and the Dow rose 5.1%.
Stocks climbed following Friday’s jobs report, which showed a labor market cooldown that could leave the U.S. Federal Reserve less inclined to raise interest rates again in the short term. In October, the economy generated 150,000 new jobs, about half as many as in September and down from an average of 258,000 over the last 12 months. October’s unemployment rate edged upward to 3.9%.
A U.S. small-cap stock benchmark, the Russell 2000 Index, climbed nearly 8% for the week, outpacing the sizable gains for its large-cap peers. The Russell 2000’s surge left the index slightly positive year to date; just a week earlier, it had fallen to its lowest level in nearly three years.
We saw breadth improve considerably and the move higher was led by small caps, giving the market a very “risk-on” view. But, we want to see a sustained recovery before we can confirm that this is indeed a rally and not just an oversold bounce led by short covering and gamma squeeze. The SP500 closed October in the red, down three months in a row.
In the crypto ecosystem it was a week that marked the 15th anniversary of the publication of the Bitcoin Whitepaper, and that certainly reflected in the price of Bitcoin, which has been mostly green since "Uptober." On October 31, 2008, the pseudonymous creator of Bitcoin, Satoshi Nakamoto, shared the Bitcoin white paper with a mailing list of cryptographers, a date that is also annually celebrated as Halloween.
Bitcoin mostly hovered between $34,000 and $36,000 this week, as investors and enthusiasts keep their eyes peeled for the potential approval of a Bitcoin spot ETF in the U.S. The highly-watched case of the once-celebrated “King of Crypto,” Sam Bankman-Fried (SBF), the founder and former CEO of the FTX crypto exchange, came to an end this week, with the court finding him guilty on all charges.
Investors head into the new week with stocks making a recovery push and Treasury yields falling back. The economic calendar is light, with the release of the Federal Reserve Senior Loan Officer Opinion Survey being one of the key releases. Analysts think the reading on bank lending conditions will be important in assessing credit and growth risks going forward. Federal Reserve Chairman Jerome Powell will speak at a panel at the IMF's annual research conference. European Central Bank President Christine Lagarde, Bank of Japan Governor Kazuo Ueda and Bank of England Governor Andrew Bailey will also speak.
Macro y news
Economic Calendar:

Earnings for next week:

U.S Macro data
The economic data this week seemed to carry a new message to it, and a changing one. The biggest takeaway seems to be that the unemployment rate, while still low, is rising, climbing to 3.9%. Meanwhile, the ISM services report suggests the economy is slowing while inflation remains an issue. This suggests that the economy is transitioning into something much more like stagflation, categorized by rising unemployment, low growth rates, and sticky inflation.
Fed stands still
The week brought a slew of policy statements, economic reports, and geopolitical developments for investors to digest. A primary driver of sentiment appeared to be the Fed’s policy meeting that concluded Wednesday. The Fed left rates steady, as was widely expected, but investors appeared encouraged by the post-meeting statement, which signaled that the recent runup in long-term Treasury yields had achieved some of policymakers’ intended tightening in financial conditions. Fed officials also seemed comfortable with the recent upside surprises in economic data, merely tweaking their description of the pace of economic growth from “solid” to “strong.”
The lynchpin is the Fed’s acknowledgment of higher long-term rates having an impact on the economy. “Tighter financial and credit conditions for households and businesses are likely to weigh on economic activity, hiring, and inflation”, the committee stated.

Despite the optimism around the Fed possibly being “done” with rate hikes, the market may be getting it wrong for two reasons. First, there's currently no evidence to suggest that inflation at any time point in the last 12 months is slowing to a rate of a 2% increase per year. In fact, month-over-month price increases have accelerated over the last two months, suggesting year-over-year inflation may be hitting a floor of 3.5%.
Secondly, the Fed’s statement itself suggests nothing easing. In fact, the first sentence, when compared to the Feb. 1 statement (nine months ago) shows that the Fed is acknowledging stronger economic growth than earlier this year. Further into the statement, the war in Ukraine placing strain on the U.S. economy has been replaced with tighter financial conditions.
December rate hike probability drops to 9.9% from 20% on Friday.

Market currently forecasting a 70.41% chance the Fed is done hiking rates for this cycle, with a 40.7% chance the rate cuts will begin in May of next year.

Unemployment rate reaches highest level since early 2022
Friday’s closely watched payrolls report seemed to confirm that the labor market was cooling. Employers added 150,000 jobs in October, below expectations and the lowest level since June, and September’s strong gain was revised lower. Meanwhile, the unemployment rate rose to 3.9%, its highest level since January 2022.

The thing about the unemployment rate rising is that the bond market historically is very good at anticipating a rising unemployment rate, and we tend to see this reflected in the yield curve, especially the 10-year minus the 2-year. This is because the 2-year typically falls to the 10-year rate as the market reprices for rate cuts.

Average hourly earnings rose 0.2%, less than expected, although September’s gain was revised higher to 0.3%. The 12-month gain fell to 4.1%, its lowest level in over two years but still above the roughly 3% level that policymakers are often believed to consider compatible with their overall inflation target of 2%.

The Labor Department’s quarterly employment cost index, released Monday, surprised modestly on the upside, indicating an annual increase in wages and benefits of 4.3%.

US growth potentially slowing down
As of November 1, the Atlanta Fed’s GDPNow model revised US Q4 GDP growth down to 1.2% from 2.3% earlier. This comes after the advance estimate for Q3 US GDP Growth came in at 4.9% in October. That’s a major drop in growth estimates. While we may see both the Q3 and Q4 numbers revised, the likelihood that the US sees a slowdown in growth is high, given that rates have surged and demand has slowed down.

The Institute for Supply Management (ISM) said on Friday that its non-manufacturing PMI dropped to a five-month low of 51.8 from 53.6 in September. The Services PMI has been declining since August, when it rose to the highest level in six months.

The current macro environment is starting to resemble the soft-landing scenario, from the post-pandemic inflationary period and the booming economy due to reopening. The question is whether the soft-landing phase is only the transition to the hard landing phase. In other words, will the slowdown eventually transition into a recession? How long until the payroll report starts showing job losses?
The reaction of Crude Oil futures to the payroll report was initially positive, reflecting some risk-taking sentiment following the equity futures, but that quickly reversed to deep losses of 1.27%. Crude oil is currently facing a delicate geopolitical situation with a high probability of supply disruptions, and yet it failed to rally, mostly due to the fears of a more significant global economic slowdown.

The market is also showing some fear of a deeper economic slowdown or a recession. Fundamentally, the recent "hot economy" has been supported by consumer spending, boosted with the pandemic related stimulus, and these excess savings are now reportedly nearly exhausted. In addition, with the job market slowing down, and the wage growth easing, consumer spending is likely to slow more drastically.
But most importantly, the effect of the inverted yield curve has not been fully reflected yet. The yield curve has been inverted since October 2022, for 12 months now, and historically the recession usually follows within 12 months of the initial inversion.

The inverted yield curve results in lower credit supply to the businesses, which eventually produces job losses and induces the credit event in the weaker indebted firms. This has always produced a recession based on historical evidence. Thus, it is likely that the current soft-landing phase is just a transition to a recession.
Treasury funding fears abate somewhat
The US Treasury announced it would borrow just $776 billion from a previously estimated $852 billion in the fourth quarter. But the more significant news came Wednesday morning, before the Fed, when the Treasury boosted its quarterly refunding to $112 billion versus estimates for $114 billion. Additionally, it resulted in the Treasury announcing a 3-year auction of $48 billion, a 10-year auction of $40 billion, and a 30-year auction of $24 billion. This was less than the estimates of $48 billion, $41 billion, and $25 billion, respectively. This sent rates on the 10- and 30-year plunging on the news.
Last week saw no Treasury auction in the afternoon, which has become a great source of volatility across markets. That will change this week with a 3-year auction on November 7, a 10-year auction on November 8, and a 30-year auction on November 9. These auctions will be critical and could reintroduce a layer of volatility in the afternoon.
The last 10-year auction did not go well, with a high yield rate of 4.61% versus a when-issued yield of 4.592%, while indirect acceptance rates plunged to 60.3% from 66.3% in September. The last 30-year auction went even worse than the 10-year auction. The 30-year auction tailed by almost four bps, meaning it had a high yield rate of 4.837% versus a when-issued rate of 4.8%. Meanwhile, indirect acceptances came in 65.1% versus 64.5% in September. If auctions this week go as poorly as the ones of the past few months, it seems likely that bond market volatility may pick up, and it is quite possible that rates could begin to head higher again.
One of the reasons bond yields have been soaring is because the world's largest buyers of bonds are gone, those being the central banks. The combination of the central bank unwinding balance sheet and no longer actively adding bonds to their holdings, along with a strong dollar, have decreased overall global liquidity levels, and that has had a direct impact on the price of US bonds, as noted by the decline in the US 10-Year Treasury futures. The decline in central bank balance sheets seems directly tied to the rise in interest rates and price plunge.

Eurozone macro data
European bond yields broadly declined as expectations rose that major central banks have completed their monetary policy tightening cycles. The yield on the 10-year German sovereign bond fell to its lowest levels in more than two months. Swiss and French bond yields also declined, as did the yield on the UK 10-year government bond.
Inflation in the eurozone slowed more than expected to an annual rate of 2.9% in October, its lowest level since July 2021, from 4.3% in September. The European Union statistics agency said a decline in energy and food prices were the main reasons for the decline.

The slowdown probably reflected weaker economic growth in the bloc as well; gross domestic product contracted 0.1% sequentially in the third quarter. The German economy, the largest in the eurozone, shrank by the same magnitude relative to the second quarter.

Germany’s Federal Labor Office reported that the seasonally adjusted jobless rate in October increased by more than expected to 5.8%. By comparison, the unemployment rate came in at 5.7% in September.

Germany's export model is under pressure. September exports fell 2.4% MoM but because imports also fell by 1.7%, the trade surplus fell only slightly to €16.5bn from a revised €17.7bn in August.

UK macro data
The Bank of England (BoE) held interest rates at a 15-year high of 5.25% for the second consecutive meeting but warned that rates would have to stay at a restrictive level for “an extended period of time.” BoE Governor Andrew Bailey said the bank “will be watching closely to see if further interest rate increases are needed, but even if they are not needed, it is much too early to be thinking about rate cuts.”

The central bank’s latest projections showed the inflation rate halving by year-end and dropping below the 2% target at the end of 2025, which is later than previously forecast. The BoE estimated that the economy would expand 0.1% for the rest of this year and remain flat in 2024.
Meanwhile, the UK housing market remained weak. The BoE reported that lenders approved 43,328 mortgages in September, the lowest level since January.
Japan macro data
Although the Bank of Japan (BoJ) tweaked its yield curve control framework, monetary policy remained highly accommodative, supporting sentiment. The central bank’s dovish stance weighed on the yen, however, which briefly weakened past the 151 level to the U.S. dollar. The Japanese currency has remained under pressure given the interest rate differential between Japan and the U.S.
The BoJ remained committed to its ultra-loose monetary policy stance at its October meeting, leaving its short-term lending rate unchanged at -0.1%. However, the central bank adjusted its yield curve control framework for the second time in three months to allow yields to rise more freely, it will now regard its 1.0% ceiling for 10-year Japanese government bond (JGB) yields as a reference, rather than strictly capping interest rates at that upper bound.

However, the BoJ said it can announce unscheduled bond purchases or fixed rate operations at its discretion, dependent on the path of global yields. Over the week, the JGB yield rose to 0.91% from 0.87%, hovering around its highest level in over a decade.
Japan’s government announced a new fiscal stimulus package worth more than USD 110 billion, aimed at boosting growth and helping households cope with the rising cost of living. The measures include cuts to income and residential taxes as well as cash handouts to low earners. Boosting growth is also a key part of the package. The announcement comes at a time when support for Prime Minister Fumio Kishida’s administration appears to be fading, with many voters disappointed by the impact of rising inflation on their purchasing power.
China macro data
China’s factory activity returned to contraction in October. The official manufacturing Purchasing Managers’ Index (PMI) fell to a below-consensus 49.5 in October, down from 50.2 in September, as production growth slowed. The nonmanufacturing PMI slowed to a lower-than-expected 50.6 from 51.7 in September. (Readings above 50 indicate expansion.)

The private Caixin/S&P Global survey of manufacturing activity fell to a below-forecast 49.5 in October from September’s 50.6. The private survey of services activity edged slightly higher but also lagged the consensus estimate.

More evidence of China’s property slump underscored investor concerns about a key growth driver for the economy. New home sales by the country’s top 100 developers fell 27.5% in October from a year earlier, easing from the 29.2% drop in September, according to the China Real Estate Information Corp.
China’s ongoing housing market decline remains a serious drag on its growth outlook for many investors despite recent indicators suggesting a demand recovery after Beijing rolled out a flurry of stimulus measures. Although China is widely expected to attain its goal of 5% gross domestic product (GDP) growth in 2023, many observers appear to believe that the economy remains vulnerable given insufficient governmental support for the housing sector. According to S&P Global Ratings, under a bear case scenario, China’s GDP growth could slow to as low as 2.9% next year as property sales fall as much as 25% from 2022.
Crypto News
=> Spain announced its aim to speed the Markets in Crypto-assets Regulation, a major digital currency advance. It regulates the crypto-asset market, making it innovative. Spain adopted the Markets in Crypto-Assets Regulation faster than expected. Europe was supposed to adopt MiCA in July 2026, but Spain wants to do so by December 2025, six months early.
Nadia Calviño, Vice-President and temporary Minister for the Economy and Digital Transformation of Spain, discussed crypto-asset regulation with Verena Ross, President of the European Securities and Markets Authority (ESMA). Spain is proactive by proposing an 18-month transition period for crypto service provider laws instead of July 2026. The National Securities Market Commission (CNMV) will have a year to analyze and approve crypto service providers.
=> The SEC has revealed its examination priorities for fiscal year 2024. The SEC's Division of Examinations is closely monitoring the rapid growth of crypto assets and related investments. They will focus on broker-dealers and advisers introducing new products and innovative practices, as well as transfer agents involved in microcaps and cryptocurrency-related assets.
=> UK unveils regulatory framework for crypto assets and fiat-backed stablecoins.
=> Singapore, Japan, UK, and Swiss Regulators Collaborate on Asset Tokenization Trials.
=> Hong Kong Signals Upcoming Regulatory Framework for Tokenization and Digital Assets.
=> Tokenized US Treasury market surges by roughly 600%.
=> Former FTX CEO Sam Bankman-Fried was found guilty of all seven charges in his criminal trial in New York, including wire fraud, securities fraud, and money laundering conspiracy. He will return to court for sentencing on March 28, 2024, which could result in a maximum sentence of up to 115 years in prison.
Bankman-Fried's attorney stated that he maintains his innocence and will continue to fight the charges against him. Other key FTX executives have pleaded guilty to various charges and testified against Bankman-Fried in the five-week trial.
=> Some of the world's largest market-making firms are in the mix to potentially provide liquidity for BlackRock's eagerly awaited bitcoin ETF if regulators approve the product, according to a person with knowledge of the matter.
Trading giants Jane Street, Virtu Financial, Jump Trading and Hudson River Trading have held talks with BlackRock about a market-making role, according to a BlackRock slide deck reviewed by the person familiar with the matter.
=> OpenSea, the NFT marketplace has announced significant organizational and operating changes as it focuses on building a more nimble version of itself. The company has said around 50% of employees will be affected across all functions, and the number of middle managers will be reduced. Meanwhile, the employees will receive four-month severance packages, accelerated equity vesting, and six months of continued healthcare and mental healthcare.
=> SafeMoon and three of its executives have been charged with fraud and unregistered securities sales by the SEC. The Justice Department has also unsealed charges against the men at the same time. SafeMoon creator Kyle Nagy, CEO John Karony, and chief technology officer Thomas Smith are accused of withdrawing assets worth $200 million from the project and misappropriating investor funds.
=> The SEC has issued a subpoena to PayPal in relation to its PayPal USD (PYUSD) stablecoin. The subpoena was sent to PayPal's Enforcement Division, which requested the production of certain documents. PayPal confirmed it was cooperating with the SEC in relation to the request.
The subpoena comes three months after PayPal launched its PYUSD stablecoin, which is backed by US dollar deposits and short-term Treasury bonds and is based on the Ethereum blockchain.
=> Switzerland's St.Galler Kantonalbank (SGKB) has partnered with SEBA Bank to offer cryptocurrency services to select customers. SGKB, one of Switzerland's largest banks, plans to expand its crypto offerings based on client demand. The bank's partnership with SEBA Bank marks its first step into the digital asset industry.
The bank’s customers can now access Bitcoin and Ether with the digital asset custody and brokerage services offered by SEBA Bank. SEBA is a Swiss-regulated bank that manages, invests, and stores cryptocurrencies, non fungible tokens, and other assets for private and retail banks.
=> CME Poised to Become World’s Largest Bitcoin Futures Exchange, Replacing Finance.
=> Coinbase debuts regulated crypto futures trading for US retail investors.
=> Binance Terminates Ruble Payment Partnership with Financial Services Firm AdvCash
=> Circle to focus on business and institutional accounts, phases out consumer accounts .
=> Aave Temporarily Pauses V2 on Ethereum and Implements Asset Freeze on V3 Due to Reported Issue
The next several months will be very interesting for Bitcoin, here’s the latest ETF 19b-4 deadlines:

Cryptos: spot, derivatives and “on chain” metrics
The cryptocurrency market started off the month of November healthily trading into the green. Most assets recorded substantial value gains, with some punching way above their weights. Meanwhile, the overall market capitalization increased by over $50 billion to comfortably exceed $1.3 trillion.
Bitcoin scored back-to-back successful weeks after claiming the $35,000 level. The king of cryptocurrencies has been on the rise, finally leaving the comfort zone at around $26,000 behind it. Recently, it has been trading well above $34,000 and seeking to surge higher. In fact, it reached almost $36,000 on Thursday before settling at nearly $1,000 less.
Ethereum has also been flying high following a 5% value boost. The second crypto in command was back in contention for the $2,000 level, which was in its grasp a handful of times this year. If this trend continues, ETH could climb above the much-coveted threshold by the month’s end.
Most altcoins have been seen trading in the green, with almost no exceptions. For example, BNB moved up by 6%, Dogecoin by 1%, TRON by 4%, and Polkadot by 14%. Meanwhile, XRP rose by almost 17%, Solana by a whopping 27%, Cardano by 15%, Toncoin by 9%, and Chainlink by 8%.
Gainers / Losers last 7 days, block size volume.

Bitcoin
Bitcoin surged to more than $35,000 in October, another record high for 2023. The year-long rally has been attributed to unconventional market trends, including excitement over the Bitcoin spot ETF applications pending with the Securities and Exchange Commission.
Investors have been positioning themselves in anticipation of a greenlight from the SEC for a Bitcoin ETF. The theory here is that an ETF will bring in institutional investors to crypto. There is also the euphoria that Bitcoin's upcoming halving event has brought to the market. The Bitcoin halving event, scheduled to occur in April 2024.
The market after a first bullish imbalance failure of the lower major structure managed to defend itself, broke through the $28100 VPOC and started a powerful breakout of the upper range. Demand has fully taken control, there is no doubt, however the verticality of the move and some overheated metrics in derivatives makes us be extremely cautious and think that we may be in a short term market climax. We need to see an effective bullish imbalance of the upper structure. Such an imbalance has to be above the previous highs preventing the price from re-entering the range.
Bitcoin 23/10/23 4h chart

Bitcoin 06/11/23 4h chart

In high timeframe charts, we are aware that we are at a key and pivotal moment for Bitcoin on a longer time horizon.
- It is entering the upper distributional range marked in red.
- Despite the first bullish imbalance failure of the structure marked in green, it has managed to defend itself and eliminate the weakness of demand.
- It has broken the VWAP anchored at all time highs (ATH).
- If the structure marked in white manages to effectively unbalance it has a clear path to test the first relevant volume node above at $38,000.
- All of this would clearly mark a complete change in behavior after the sharp declines of 2022.
Bitcoin 23/10/23 Daily chart

Bitcoin 06/11/23 Daily chart

Derivatives and On-chain metrics:
The long-lasting volatility compression in crypto over time increased options dealers' exposure to gamma. In addition to substantial spot demand, longs entering, and short liquidations, hedging from dealer gamma also contributed to elevated buying pressure.
As we have indicated previously, in the short term we are concerned about overheating in the derivatives markets, which indicates that a short-term correction is very likely. The recent market dynamics underscore the delicate interplay between spot and derivatives markets in influencing Bitcoin’s price trajectory, and the need for investors to tread cautiously amidst a turbulent trading landscape.
All Bitcoin derivatives markets are overheated at present. This following chart captures perps, futures and options open interest.

The relevancy of Bitcoin options has never been more significant in the Bitcoin derivatives market. Bitcoin options saw all-time high volumes in the past week, and gamma hedges contributed to levating spot demand for Bitcoin amidst the October 23 rally. Throughout the bear market, options have become a more and more relevant factor in the market compared to the past market cycle. This means that active market participants should pay close attention to options flows and greeks to stay fully informed on the state of the market ahead.

On Monday, October 23, dealers were short gamma and needed to buy Bitcoin in spot markets to remain delta-neutral, causing a volatility expansion in Bitcoin. The gamma squeeze was one out of several components exacerbating Bitcoin's rally, as spot demand grew, shorts got squeezed, and new longs entered the market.
Dealers are still short gamma and could need to buy $20m of Bitcoin spot for every 1% move in Bitcoin should Bitcoin reach the $35,750-$36,000 range. However, dealers’ positions can shift quickly when prices change, meaning that the currently implied buy pressure might not materialize fully when prices actually go up.
The Bitcoin skew, which measures the balance between options to sell (puts) and options to buy (calls) for Bitcoin, reached its lowest point in 2023. When the skew gets this low, history suggests that Bitcoin’s price might correct and hit a short-term top.


The level of confidence in digital assets is apparent when assessing the recent performance of the Total Altcoin Market Cap. The local move upwards recorded a +21.3% increase in the sector valuation, with only six trading days registering a larger percentage change. This highlights a waterfall effect of investor capital, as rising Bitcoin dominance tends to inspire an uptick in altcoin valuations relative to fiat currencies.

However, it is important to recall that Bitcoin dominance is continuing to rise. On a relative basis, Bitcoin now commands over 53% of the digital asset market valuation, with Ethereum, Altcoins at large, and stablecoins all seeing a relative decline in their dominance throughout 2023. Bitcoin dominance has increased from a cyclical low of 38% hit in late 2022.

To close out this perspective, we can compare the YTD increase of the Bitcoin vs Aggregate Altcoin market cap (excl Stablecoins). Bitcoin's market cap has increased by 110% in 2023 compared to Altcoins rising by an impressive, but relatively small 37%. This highlights an interesting market dynamic, whereby the altcoin sector is outperforming fiat currencies and traditional assets like Gold, but are meaningfully under-performing Bitcoin.

We have seen the first substantial increase in altcoin sector market valuations since the last cycle peak. However, it is important to note that this performance is measured relative to fiat currencies, namely the USD. Within the digital asset realm, Bitcoin dominance continues to rise, leading to the BTC market cap increasing by over 110% YTD.
Ethereum
Ethereum, after having remained for several weeks in the demand zone marked on the chart without any response, has finally managed to wake up from its lethargy. Although the show of demand strength has not been as vigorous as in the case of Bitcoin, it has managed to break out of this zone.
The next big battle for the bulls lies in consolidating above the VWAP anchored at historical highs, which as we can see has been a clear sell zone. Ethereum is less mature than bitcoin, but it is giving first positive signs for consistent bullish scenarios.
Ethereum 23/10/23 4h chart

Ethereum 06/11/23 4h chart

BNB
We will closely monitor the evolution of BNB as a measure of risk perception. BNB is the cryptocurrency coin that powers the BNB Chain ecosystem. BNB is one of the world's most popular utility tokens and it is used primarily to pay transaction and trading fees on the Binance exchange. It is Binance's flagship token.
At first glance we note that the Vwap anchored at highs has never been exceeded or practically tested since late 2021. The vigorousness with which the Vwap anchored at the local lows of June 2022 has been broken through makes us aware of the major weakness on this token.
BNB, taking advantage of the market momentum, has managed to get out of the danger zone, clearly located at $220. The next big battle for demand lies in conquering the Vwap (green) anchored at the previous relevant lows.We believe it is very necessary to follow very closely the evolution of this token, as it could anticipate a new CEX crisis.
BNB 23/10/23 4h chart

BNB 06/11/23 4h chart

Classic markets
Bear Market Rally, Epic Gamma Short Squeeze:
Actual market behavior: "positive" catalyst (last week "dovish" Powell) => crunch vol + buy tech + squeeze options bearish positioning + YOLO (Xmas rally, presidential cycle, AI bull market, CTA max short and now max long, this time is different) => Sell Off => repeat until something serious happens and really breaks something.


Bear market rallies are notoriously violent and abrupt. And last week was among the most violent and abrupt of them all. While implied vol (IV) cratered over the week, and betrayed zero interest in hedging for the weekend. There is no greater risk situation in which the risk is not perceived. The prevailing market dynamics have managed to make the rest of the participants believe that there is no risk in sight, all this at the gates of a recession and in the most turbulent geopolitical environment since World War II.
Although the reader may think that last week's rally is due to a real show of buying strength, unfortunately this is not the case. An epic gamma short squeeze drove stocks higher this week, driven by a compilation of factors that aren't likely to persist. Stocks are trading more in sync with bonds than at any time in recent memory, and this week saw a big move lower in rates, starting Wednesday morning.
The groundwork was laid out on Monday when the Treasury announced it would borrow just $776 billion from a previously estimated $852 billion in the fourth quarter. But the more significant news came Wednesday morning, before the Fed, when the Treasury boosted its quarterly refunding to $112 billion versus estimates for $114 billion. Additionally, it resulted in the Treasury announcing a 3-year auction of $48 billion, a 10-year auction of $40 billion, and a 30-year auction of $24 billion. This was less than the estimates of $48 billion, $41 billion, and $25 billion, respectively. This sent rates on the ten- and 30-year plunging on the news.
Given the relationship between stock and bond prices, it is not surprising this week's plunge in interest rates directly played the trigger in stocks ripping higher. But rates were merely the trigger in pushing the equity market higher because once rates fell, it resulted in a gamma squeeze of epic proportions from the options markets.

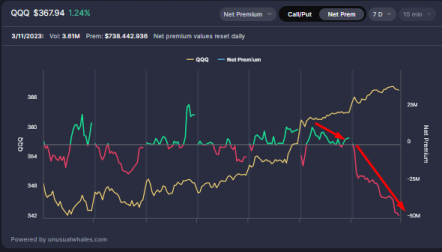
In fact, the move had been in the works for two weeks. We observed net bullish flows in the SPY´s options with the market correcting sharply and a strong divergence of the SPY with the SVIX (short VIX ETF). The market was buying the dip and trying to forcefully suppress the "risk off" that had prevailed during the previous weeks.


The SP 500 was deeply in negative gamma territory last week. Net gamma in the SP500 was the lowest since the summer of 2022. Negative gamma environments produce a large amount of volatility and also tend to exacerbate moves in the market. When equity markets are in negative gamma, options dealers are buying or selling SP500 futures in the same direction as the market. When the market is falling in negative gamma, market makers are sellers of futures, and when the market is rising, market makers buy futures.

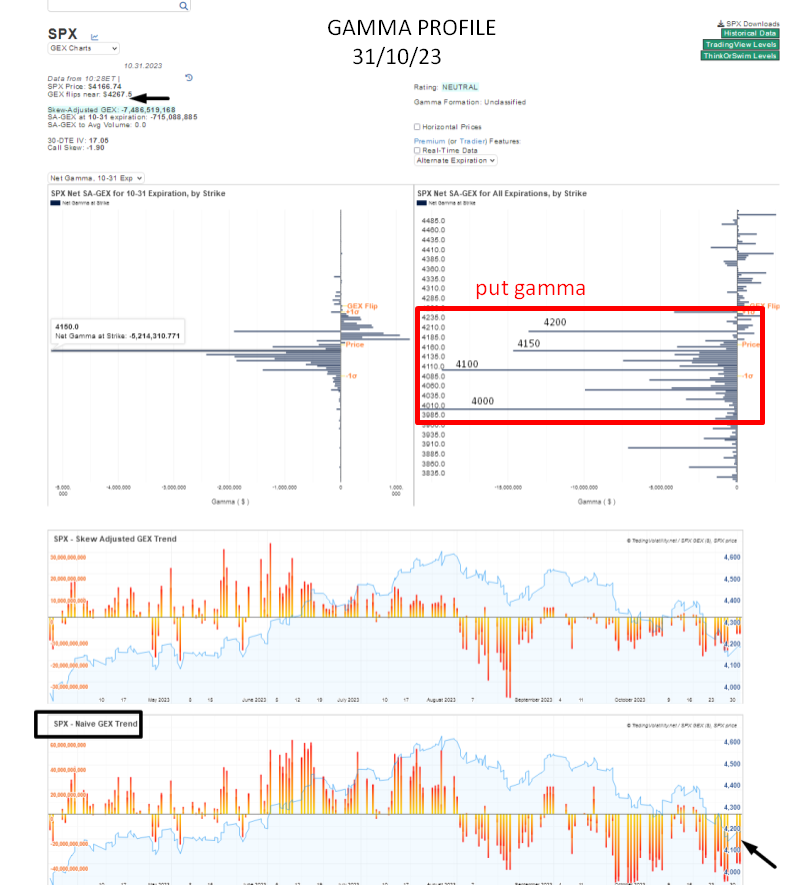
This huge negative GEX of each downward impulse (which hover around -6% and -7%) hides a reality. The market, as an abstract entity, knows that this is not a bull market, nor a softlanding. It's a market without positive catalysts in denial phase trying to create its own reality and moving only by its internal dynamics derived from the options and systematics flows, all clearly outside the macro. This is precisely why there is so much fear (negative GEX) in such a short time and in such small stretches.
We emphasize, a market without positive catalysts and doomed, the only thing left is the squeeze game. Note how the 3 recent bullish impulses are nothing more than a squeeze of extreme negative gamma exposure and are quickly reversed.


The day over day change in the dealer Gamma positioning here by GS estimates is the largest on record. Dealers are now LONG ~$4bn of SPX gamma.

Once all the bearish positioning was annihilated and the VIX was crushed, as usual, the market followed the path set by the O-1 DTE options.

However, we continue to insist that a sustainable market trend is not only fueled by squeezes, vol crunch , magma 7 and options 0 DTE leading the market in the intraday. The net flow in SPY and QQQ options has left us with severe divergences over the past week. We firmly believe that the market is in a situation of structural weakness not seen in years. And while nothing catastrophic has to happen, it is the way the market is set up for something catastrophic to occur.

The combination of the decline in rates and the lack of Treasury auctions gave equity markets a clear path to rally with no interruptions throughout the trading day, and that resulted in the large amount of buying we saw all week. But the data now shows that the SP500 as of Friday has flipped back into positive gamma, and that means that market makers are sellers of strength and buyers of weakness. This will help to ease volatility in the market and means that the velocity of the significant gains of last week is likely behind us.

Meanwhile, the level in the SP 500 with the most significant concentration of gamma and the level with the biggest level of call gamma is at 4400 - 4450. It will cap any further rise in the SP500 in the near term unless the options market moves the call wall higher by buying calls with higher strike prices. If the Call wall does not roll higher, the options market will likely keep the index contained around 4400 or lower. This is essentially why the SP500 ran out of energy by the end of the day on Friday.
Vanna rally
Vanna measures the change in delta for a change in IV Options market makers are typically long vanna. When IV crushes they must buy stock back to reduce their hedges . This is what fuels “V” shape rallies that occur after large negative gamma induced market drawdowns.
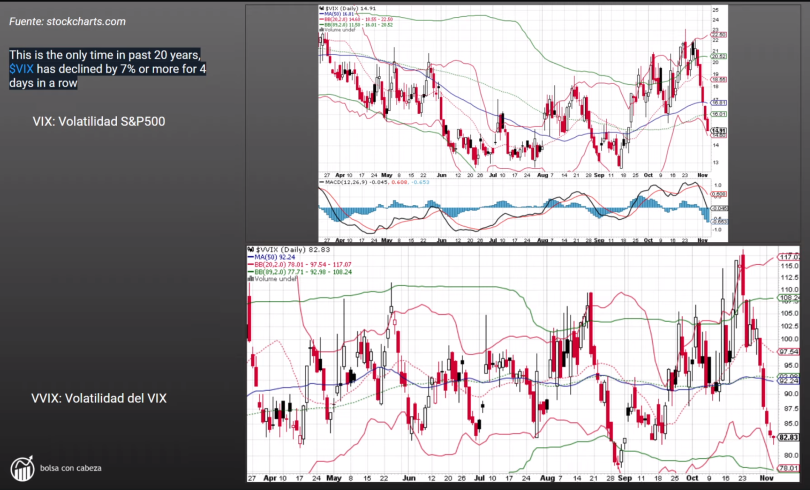
Last week's market extreme melt up had everything to do with Vanna and implied volatility melting. This is the only time in the past 20 years, where VIX has declined by 7% or more for 4 days in a row. The equity rally has used a lot of energy, with the VIX moving from 21.3 on Friday to 16.85. On October 16, when the VIX was last at 17.20, the SP500 was 4373. So we have certainly rebounded, but the SP 500 is about 135 points lower. So, it may take the VIX returning to 15 to get the index back to the region of 4400.
UVIX (long x2 VIX ETF) is down 37% in 4 days; this has been a week of historically extensive VIX crush.

It can be said that the market has given a flamethrower to an arsonist. Instruments, derivatives and even investment vehicles that sell volatility have boomed in recent years. Selling vol works until it doesn't. These are primarily hedged strategies, but the overall appetite for vol writing is getting high, especially in the short term, with funds writing 0 DTE puts even coming out recently. It's "free money" until it isn't, in a big way.

Flows to ETFs using options have quintupled over the past two years.

From Tier1 Alpha:
One of the more interesting charts that came out of our weekend work was the behavior of skew for the Nasdaq 100. Remember that skew is a measure of how "non-normal" a distribution is. A normal distribution does a poor job of describing equity returns; they tend to exhibit "fat tails" as popularized by Nassim Taleb in his work. Inevitably, we focus on the left tail dynamics. But occasionally, markets become extremely RIGHT-tail skewed, especially during secular bear markets. That's right. We said it:

In the 1998-2001 "skew bull," markets rose in a nearly uninterrupted manner, causing skew to "gain" both from dropping off the events of 1998 AND from an increasingly "right-tailed" bias. While we think it's important to note that the NDX of 1998-2001 had a large element of "meme" stock to it, the general outline looks similar (just imagine switching to ARKK in 2020-21).

Metrics and ratios
The bond market has a good track record in predicting future Fed rate moves. In particular, the 2-year Treasury rate (US2Y) forecasts Fed rate changes very well over the next 6 months or so. But this is not only one of its characteristics, as can be seen in the following chart, as soon as the US2Yr makes a top and begins to unwind, it marks the top of the stock market.

SPX vs 10Y/3M curve post-1980 recessions.

Last week was one of the most dramatic changes in one measure of breadth that we have seen in such a short time with less than 20% of NYSE llisted stocks above their 20 day moving average to start the week and nearly 75% of the same above their 20 day moving average to end it.

This led the NYMO to showing a significant breadth thrust into overbought territory, which may provide an opportunity for the market to cool off a bit.

Last week was also the first week in about two months that we saw new highs outpace news lows on the NYSE. Looking below, we can see that 2023 hasn't really looked much like the bull market we experienced in 2021, where new highs consistently outpaced new lows as upside participation was much more broad-based.

This strong push higher was, in part, led by some of the lowest quality components of the market. The most shorted basket of stocks rallied up 13%, clocking their most impressive gain in almost a year.

Ultimately, this vanna rally and gamma short squeeze has caused US equities to be aggressively net bought and saw the largest notional net buying since Dec ‘21 (+2.8 SDs vs. the past year), driven by short covers as well as long buys (~1.1 to 1). This week’s notional net buying ranks in the 99th percentile vs. the past 5 years.
And of course, the last link in the chain, retails, has come back in a big way in terms of bullish sentiment.

After a near 8% rebound in the Russell from its trough and a 7.44% uptick in Dow Jones Micro-Caps, along with a 4-sigma swing in the 10-year treasury yield, it's a prudent moment to pause and consider if the landscape has really shifted.

In the span of the past half-decade, the rolling correlation between the SP500 and the Russell 2000 has been consistently robust, ranging from 0.76 on the lower end to 0.95 at its peak, signaling a tight parallel movement. Presently, we're seeing a correlation around 0.86, which can fluctuate with the days and weeks. The nearer this value edges towards, the stronger their positive correlation becomes. The significance of this metric lies in its utility; the Russell versus S&P correlation can inform our understanding and expectations for the broader indices.
Despite recent gains, the Russell maintains a strong bearish pattern. It has bounced off its peak from January 2020, but remains in a downturn. The markets have initially welcomed Chairman Powell’s non-committal stance last week, followed by a buoyant response to lackluster ISM figures, and it was true love when investors saw the slowing ADP and NFP statistics.
This dynamic where bad news is paradoxically good news is in play, yet our stance is that this will soon shift to a scenario where bad news is just that, bad news, as the market comes to terms with the fact that a Fed pause does not equate to an easing policy. If we assume the correlation endures, a dip in small caps could signal a forthcoming downturn in the larger indices as well. A recession means top-line revenues fall, business pricing power diminishes, lending standards remain tight, and unemployment rises. Assuming the correlation holds, small caps begin to decline again, and so will the larger indexes as well.
Market Comment
In this section for this week we will be brief because we will not be the ones trying to grab the rocket in the direction of nowhere. We believe this vanna rally will be returned sooner rather than later. The levels to watch are those marked with the red arrows, former major and minor buying controls. A recovery and consolidation of the Vwap (green) anchored at previous relevant highs seems unlikely to us.
In this case, and applicable to many other facets of life, it does not matter how far it goes, but how it gets there.


