.png)


.png)
In the absence of any major macroeconomic data, and with Wall Street being closed for Thanksgiving, the week was fairly quiet. U.S. stocks closed slightly higher on Friday to mark four consecutive weeks of gains. Of the 11 S&P sectors, nine closed in positive territory during the shortened session, led by Health Care. Communication Services and Technology were the two losers. For the week, the Dow gained 1.27%, while the S&P 500 advanced 1% and the Nasdaq Composite tracked 0.89% higher.
The Mastercard SpendingPulse data noted that black Friday shopping increased by 2.5% y/y, down sharply from a 12% y/y increase in 2022. When we think about this, adjusted for inflation, that would suggest a decline in Black Friday shopping in real terms, no matter which measure of inflation is used.
The week brought one carefully watched third-quarter earnings report, with shares in artificial intelligence chipmaker NVIDIA (recently, the world’s sixth-largest company by market capitalization) falling after the company beat earnings and revenue estimates but issued cautious guidance because of export restrictions to China.
All Federal Reserve officials agreed to "proceed carefully" with interest rates, according to the minutes from the FOMC's latest policy meeting released on Wednesday. Members wanted rates to stay restrictive "for some time," as inflation remains above the 2% objective, with virtually no interest in cutting rates anytime soon. Fed officials also saw Q4 economic growth cooling "markedly" from the 4.9% jump in Q3. At the Oct. 31-Nov. 1 meeting, policymakers held the federal funds target range steady at 5.25%-5.50% (the highest level in 22 years) after boosting it in July. Traders are largely certain that the Fed will maintain rates this year, with the odds of a rate cut priced in for 2024.
The energy sector will be tuned into the delayed OPEC+ meeting next week amid reports of disagreements among members over how much production to cut. Crude oil futures have steadied over the last week in front of the OPEC meeting, but are down more than 10% over the last six weeks.
Key economic reports in the week ahead include updates on new home sales, consumer confidence, construction spending, and the latest reading on the Federal Reserve's favorite inflation gauge. The PCE report for October, which is coming this Thursday, is expected to rise by 3.1% y/y and 0.1% m/m in October, down from 3.4% y/y and 0.4% m/m. Core PCE is expected to increase by 0.2% m/m and 3.5% y/y, down from 0.3% m/m and 3.7% y/y in September.
This week's crypto news highlights a series of legal developments involving major players, as the US DOJ levied a $4.3 billion settlement on Binance and its founder Changpeng Zhao (CZ) who pleaded guilty and resigned as a CEO.
Binance's BNB token dropped by 9.2% in 24 hours, coupled with outflows totaling $1.3 billion in a week. Notably, these funds reportedly found refuge in Coinbase Pro, reflecting shifting investor sentiments.
SEC sued Kraken on charges of operating an unregistered exchange and fund commingling which Kraken rebuts. Furthermore, the court of appeal turned down Sam Bankman-Fried’s request for his temporary release while the former Chief Executive Officer awaits charges on counts of fraud, racketeering, and money laundering. These cases show how the regulatory surveillance of this industry is getting more intense.
The cryptocurrency market has been calm the past week, and ending on Friday, Bitcoin showcased an intruding development that was influenced by the awaited Grayscale spot Bitcoin ETF approval. Bitcoin rallied and touched $38,000 during the Friday US Thanksgiving holiday, indicating a fresh 18-month high.
Macro y news
This Week's Major U.S. Economic Reports:

Earnings for next week:

U.S. Macro data
The US Economy continues to surprise and frustrate in equal measure. Each time we get a few data releases which suggest a cooling in the economy, it is usually followed by a data print that suggests the opposite. This week has been no different even though the calendar has been a bit quiet coupled with the Thanksgiving Holiday.
This week saw initial jobless claims fall once more just as it seemed that the labor market may be entering a phase of sustained cooling. This week's print however will keep market participants on the edge heading into next month’s jobs data and inflation prints. A robust labor market will continue to keep demand at elevated levels and thus inflation and this is where the concern comes in.
On Wednesday, the Commerce Department reported that durable goods orders had dropped 5.4% in October, marking the second-biggest decline since April 2020. Economists polled by Reuters had forecast durable goods orders would decline 3.1%. Durable goods orders rose 4.0% on a year-over-year basis in October.
A sharp drop in highly volatile civilian aircraft orders was largely to blame, but orders excluding aircraft and defense purchases (typically considered a proxy for business investment) also fell slightly for the second month in a row.


On Friday, S&P Global released its estimates of growth in business activity in November, which indicated that a pickup in the services sector (the fastest in four months) had compensated for a bigger-than-expected slowdown in manufacturing. However, S&P also noted that “relatively subdued demand conditions and dwindling backlogs led firms to cut their workforce numbers for the first time since June 2020.

Eurozone macro data
European government bond yields edged higher. Germany’s 10-year government bond yield climbed from a more than two-month low of 2.516% earlier this week. Yields rose after reports that Germany intends to suspend debt limits for the fourth consecutive year and on statements suggesting that European Central Bank (ECB) policymakers are determined to keep monetary policy tight for the time being.
ECB policymakers reiterated that the fight to curb inflation was not over and sought to disabuse financial markets of expectations that the central bank would soon cut interest rates. ECB President Christine Lagarde said rates could be steady over “the next couple of quarters,” while France’s François Villeroy de Galhau said rates have reached a plateau where they will probably remain for the next “few quarters.” Belgium’s Pierre Wunsch said the ECB is likely to stand pat both in December and January. Separately, the minutes of the ECB’s October meeting revealed that policymakers insisted that another rate hike should be kept on the table, even if further policy tightening was not part of the main scenario.
Eurozone PMI shrinks for sixth month in a row.
An S&P Global purchasing managers’ survey showed that eurozone business activity fell for a sixth month running in November, a sign of a looming recession. The HCOB Flash Eurozone Composite PMI Output Index reading was 47.1, up from a three-year low of 46.5 in October. PMI readings less than 50 signal a contraction.

Japan macro data
The Nikkei rose to its highest level since 1990, boosted by a strong domestic corporate earnings season, with manufacturers’ earnings benefiting from weakness in the yen and easing supply chain constraints. On the economic data front, a hot October consumer inflation print stoked speculation about further monetary policy normalization by the Bank Japan (BoJ). Private sector activity stalled in November, according to flash PMI data, largely due to further deterioration in business conditions in manufacturing.

Japan’s core consumer price index (CPI) accelerated for the first time in four months in October, rising 2.9% year on year (y/y), following a 2.8% y/y increase the prior month. Although falling short of consensus expectations of a 3.0% rise, the hot CPI print showed that inflation continued to hover above the BoJ’s 2% target for the 19th straight month and fueled speculation that tighter monetary policy could be imminent in Japan.

China macro data
Chinese regulators formulated a funding plan for property developers in its latest efforts to consolidate growth as the country grapples with an ongoing property crisis. The list, which reportedly includes 50 private and state-owned developers, will act as a guide for financial institutions to deliver a range of financing measures to strengthen balance sheets, according to Bloomberg.
Separately, the National People’s Congress, China’s parliament, encouraged banks to accelerate support measures for real estate developers to reduce the risk of further defaults and ensure the completion of outstanding housing projects. The reports follow recent property data that underscored an ongoing downturn in a key sector for China’s economy. Property investment, sales, and new home prices slumped in October.

Many economists anticipate that Chinese government advisers may propose an economic growth target of around 5% in 2024 at the annual Central Economic Work Conference in December. The gauge will be aimed at promoting job growth and to ensure long-term development goals remain on track.
Crypto News
In the past week, the global crypto market has experienced a mix of positive and negative news. Unfortunately, the negative stories took the spotlight.
=> Binance CEO Changpeng Zhao “CZ” has pleaded guilty to one felony charge as part of a $4.3 billion settlement over criminal and civil cases with the exchange. The settlement with the US Department of Justice will cover "civil regulatory enforcement actions” by government departments, including the US Treasury and Commodity Futures Trading Commission. The US Treasury will receive over $4 billion in penalties, while Binance will be subject to monitoring and reporting requirements and required to file suspicious activity reports for past transactions. CZ has resigned as CEO, and Richard Teng, the now-former Global Head of Regional Markets of the crypto giant, has assumed the position.
=> Brian Armstrong, CEO of Coinbase, called Binance co-founder Changpeng Zhao’s resignation an opportunity to start a new chapter for the crypto industry.
=> The SEC has filed a lawsuit against Kraken, accusing the cryptocurrency exchange of commingling customer funds and operating without proper registration. The SEC claims that Kraken has been facilitating the buying and selling of cryptocurrencies unlawfully since 2018. The agency also alleges that Kraken's business practices and internal controls resulted in the commingling of up to $33 billion worth of customer assets with its own, posing a significant risk to clients. Kraken has expressed disagreement with the SEC's complaint and intends to defend itself in court, saying they “plan to vigorously defend our position.”
=> BlackRock, along with representatives from Nasdaq, met with the SEC to discuss the potential listing of a spot Bitcoin exchange-traded fund (ETF). In a presentation, BlackRock outlined two proposed models for its iShares Bitcoin Trust, involving in-kind or in-cash redemption. The SEC's response and approval of a spot Bitcoin ETF remain uncertain, but reports suggest that the agency is nearing a decision. Grayscale, another asset manager, also met with SEC officials to discuss its Bitcoin ETF bid. If approved, a spot Bitcoin ETF could be a significant step towards mainstream adoption of cryptocurrencies.
=> Sam Bankman-Fried, the founder of cryptocurrency exchange FTX, will remain in jail after his bid for release was rejected by a United States appellate court. The court cited Bankman-Fried's alleged witness tampering as the main reason for the rejection. Bankman-Fried had argued that his actions were protected under the First Amendment, but the court ruled that witness tampering falls outside the scope of constitutional protection. SBF, who was found guilty of fraud and money laundering charges, will stay behind bars until his sentencing on March 28, 2024.
=> A Montenegro court has approved the extradition of Do Kwon, co-founder of Terraform Labs, to either South Korea or the United States. Kwon was arrested in March 2023 for using forged documents while attempting to flee Montenegro. He was later sentenced to four months in prison for document forgery. The final decision on his extradition will be made by Montenegro's Minister of Justice. If extradited, Kwon faces a fraud-related civil lawsuit in the US and potential criminal charges. In South Korea, he could face a lengthy jail sentence for his alleged crimes.
=> HTX (formerly Huobi Global) suffered its fourth attack in two months, losing $30 million via a hot wallet hack on Nov. 22. The exchange promised to compensate users for their losses and has already restored services. The previous day, the HTX Eco Chain (HECO) bridge was exploited for $86.6 million. HTX was hacked for $7.9 million in September, followed by a $100 million hack against the Poloniex exchange, a related entity, in November. Justin Sun, the Chinese blockchain personality and de-facto owner of HTX, stated that all user assets are safe and that the exchange will compensate for the losses.
=> KyberSwap has become the latest decentralized exchange to fall victim to a hack, with the attacker draining nearly $50 million from the DEX aggregator.
=> Cryptocurrency fintech firm Kronos Research has confirmed the news of a hack, where the attackers had somehow gained access to the company's API keys and made off with various crypto assets.
Latest ETF 19b-4 deadlines:

BONUS: What happens to Tether after Binance’s settlement with the DOJ and the US government?
The historic images of crypto’s kingpin exiting a Seattle court last Tuesday after he pleaded guilty to a host of criminal charges were expected. The timing was also expected, coinciding roughly with one year after the FTX implosion and soon after its founder and CEO Sam Bankman Fried was sentenced. What wasn’t expected was that the Department of Justice and the US government would enter into a historic settlement agreement with Binance’s founder and CEO Changpeng Zhao (CZ) in which it was agreed that he would cooperate with the authorities to provide them with information, step down from CEO, and have Binance pay up to $4 billion in fines. CZ will also stand trial and may face up to ten years in prison.
However, looking at the documents of the settlements detailing the acts of the crimes and the blatant and voluminous sanction breaking with millions of US Dollars passed to Iran, Syria, North Korea, Cuba, and the Russian-occupied territories in Ukraine, it is clear that with Binance, the US federal authorities and the government have a bird’s eye view of the massive complex international world of sanction-evasion, money laundering, and illicit terrorist financing.
US authorities get their hands on a multi-national and multi-billion-dollar-worth centralized money exchange from which many of the world’s illicit funds have flowed. As for the Department of Justice, this is a victory of truly massive proportions.
Now that Binance is under surveillance by US authorities, they can reach out and identify many bad actors who used Binance to move their funds, and, more importantly, they can obtain a significant amount of information on one of crypto’s last remaining giants: Tether.
Tether is being investigated by the DOJ for similar reasons as to why Binance was investigated, but it also has its share of investigations in Europe with Italian prosecutors suspecting that USDT was used by the Italian mafia and Latin American groups exporting drugs to Europe in their trading activities. In fact, just after CZ’s plea deal was announced, Tether also announced that it had “onboarded” on its platform the United States’ Secret Service and was cooperating with the FBI. So, basically, Tether has admitted that the US authorities are looking into its books.
So far, it’s business as usual with Tether as it keeps printing new USDt as if the crypto market depends on it. On the other hand, trading volume on Binance is decreasing significantly and the CME has topped Binance in BTC futures open interest futures. If the SEC had claimed that Binance was engaged in wash-trading and self-dealing, Binance would undoubtedly be winding down these activities altogether under the current supervision of the authorities if it hadn’t halted them already. Bad actors will flee Binance and move elsewhere, while Tether enters its moment of truth.
It’s going to be interesting to see how Tether moves forward from this point. If it’s business as usual for Tether, then it may actually have the reserves it frequently boasts about but does not prove to own, but this is not enough at this point. If Tether’s crimes are as extensive as Binance’s, Tether is not guaranteed that it will have a sweetheart deal like Binance’s. The US government’s concern about Tether’s existence will be much higher than Binance’s given that Tether has, allegedly, the biggest crypto bridge for US Dollars: a strategic financial link in crypto that the US government would want to make sure it is either highly regulated and monitored on a constant basis or else, non-existent at all. This would also probably mean bringing Tether onshore as opposed to having it structured in its opaque and offshore manner.
What’s striking in all of this is that the US authorities are taking on the biggest players in the crypto industry by cautiously refraining from indirectly or directly damaging crypto markets. The US government’s intent and policy with regard to crypto is very clear if it is being reflected by the way the federal authorities are conducting their investigations and arraignments. The US wants to reign in crypto, and address criminal ongoing and threats to national security, but it doesn’t want to bring the whole house down.
Cryptos: spot, derivatives and “on chain” metrics
Bitcoin’s week was quite volatile, fueled by the recent developments on the Binance-US authorities front. The Department of Justice announced a massive settlement deal with the world’s largest exchange that saw the latter pay $4.3 billion without admitting guilt, and its CEO and founder CZ had to step down from his position.
As a response, Bitcoin dumped to a weekly low of $36,600 before it bounced off rather immediately by a grand. More fluctuations followed, and the culmination came on Wednesday when the bulls initiated a notable leg-up that drove bitcoin to an 18-month peak of $38,500. However, the asset failed to maintain its momentum and retraced back down to under $38,000, where it has been stuck for the past couple of days. This means its market capitalization has remained stuck at $740 billion, and so does its dominance over the altcoins at 51.3%.
Just like with BTC, most altcoins went through a volatile rollercoaster in the past several days, but most have calmed now. The landscape on a daily scale shows minor losses from XRP, BNB, SOL, and DOGE, while ETH, ADA, AVAX, MATIC, and DOT have insignificant gains. The most substantial daily jumps come from Chainlink and Tron as both have spiked by around 3%. On a weekly scale, BLUR has emerged as the top gainer. The NFT platform’s native token has soared by more than 70%. The total crypto market cap is close to $1.450 trillion.
Gainers / Losers last 7 days, block size volume.

Bitcoin
The market after a first bullish imbalance failure of the lower major structure managed to defend itself, broke through the $28100 VPOC and started a powerful breakout of the upper range. Demand has fully taken control, there is no doubt, however the verticality of the move, the overlap of the last few weeks upon reaching the nearest relevant volume nodule and some overheated metrics in derivatives makes us be extremely cautious and think that we may be in market climax.
Last week we were looking for pullbacks to validate the bullish imbalance of the intermediate structure (marked in gray) however, the market has refused to correct in the slightest, leaving a serious overlap that will be analyzed in detail later on. We continue to insist that we want to see an effective bullish imbalance of the intermediate structure. Such an imbalance has to be above the previous highs preventing the price from re-entering the range.
Bitcoin 20/11/23 4h chart
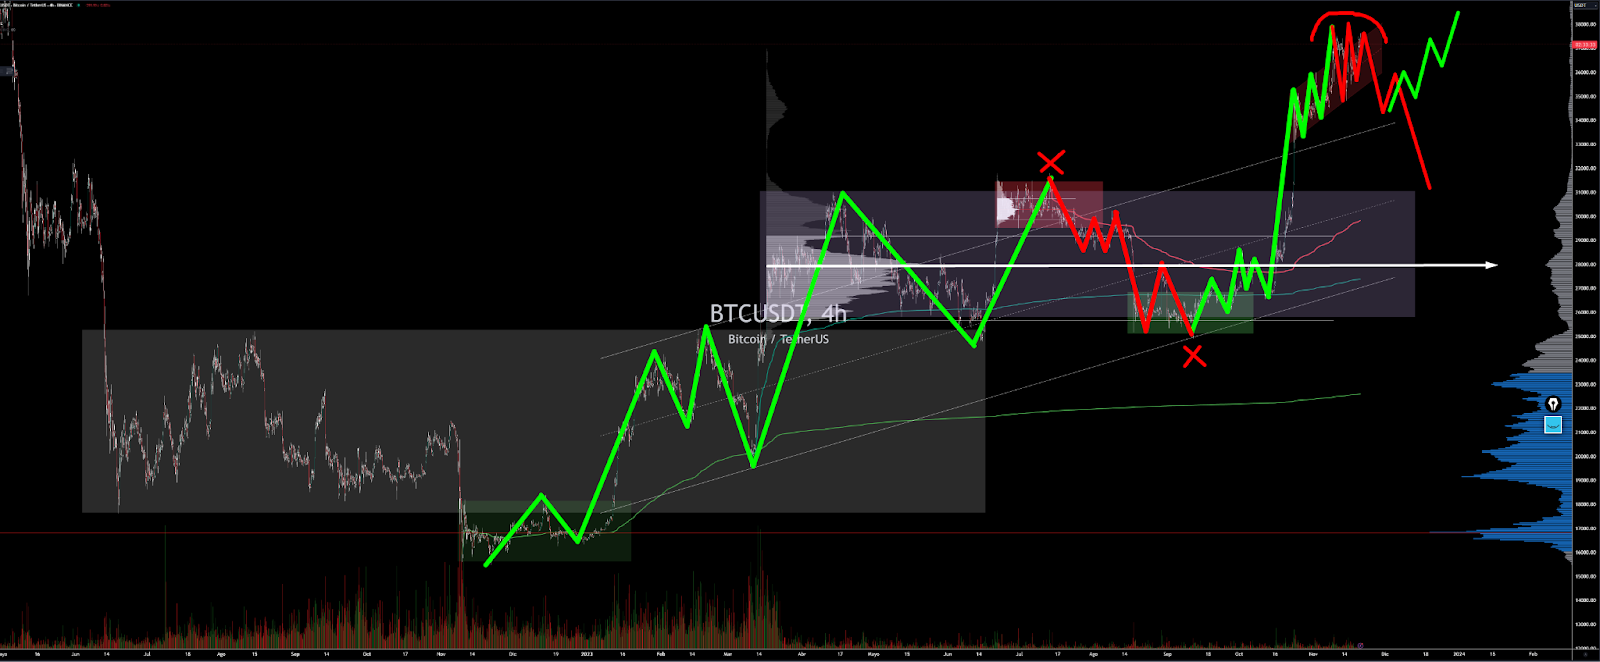
Bitcoin 27/11/23 4h chart

Doing the same analysis on Bitcoin futures on CME, we note that the market is facing the VPOC of the large distribution of years ago. The market's price action as it tests this important zone is showing clear signs of buying exhaustion. We consider it unlikely that the market will be able to break above this zone without prior retracements.

On a low time frame chart we see a steeply sloping value area, with a minor demand zone at $36000 but with a well marked sell initiative zone. We believe that the market is starting to be exhausted and the sell initiative zone is getting stronger. The key area for buyers is the VPOC at $34500, losing this area would trigger a sharp move to the downside. It seems to us certainly complicated that the market continues in this overlapped dynamic so we are very conservative in both bullish and bearish approaches, the areas to be conquered by the bulls and bears are pretty clear.
Bitcoin 20/11/23 5 min chart

Bitcoin 27/11/23 5 min chart

Ethereum
Ethereum price surged above $2,000 on November 9th, after BlackRock confirmed plans to launch an Ethereum Spot ETF in a NASDAQ filing. Ethereum's price fell below the key $2,150 level two weeks ago after weeks of aggressive rally and has since failed to regain it.
Ethereum, after having remained for several months in the demand zone marked on the chart without any response, has finally managed to wake up from its lethargy. Right now we are in the sellers' initiative zone, which has previously left several rejections. Bulls should demonstrate with determination by reversing the price action every time the market reaches this zone. A clear breakout and consolidation above this zone would open the door to a very promising long-term bullish scenario.
Ethereum 20/11/23 4h chart
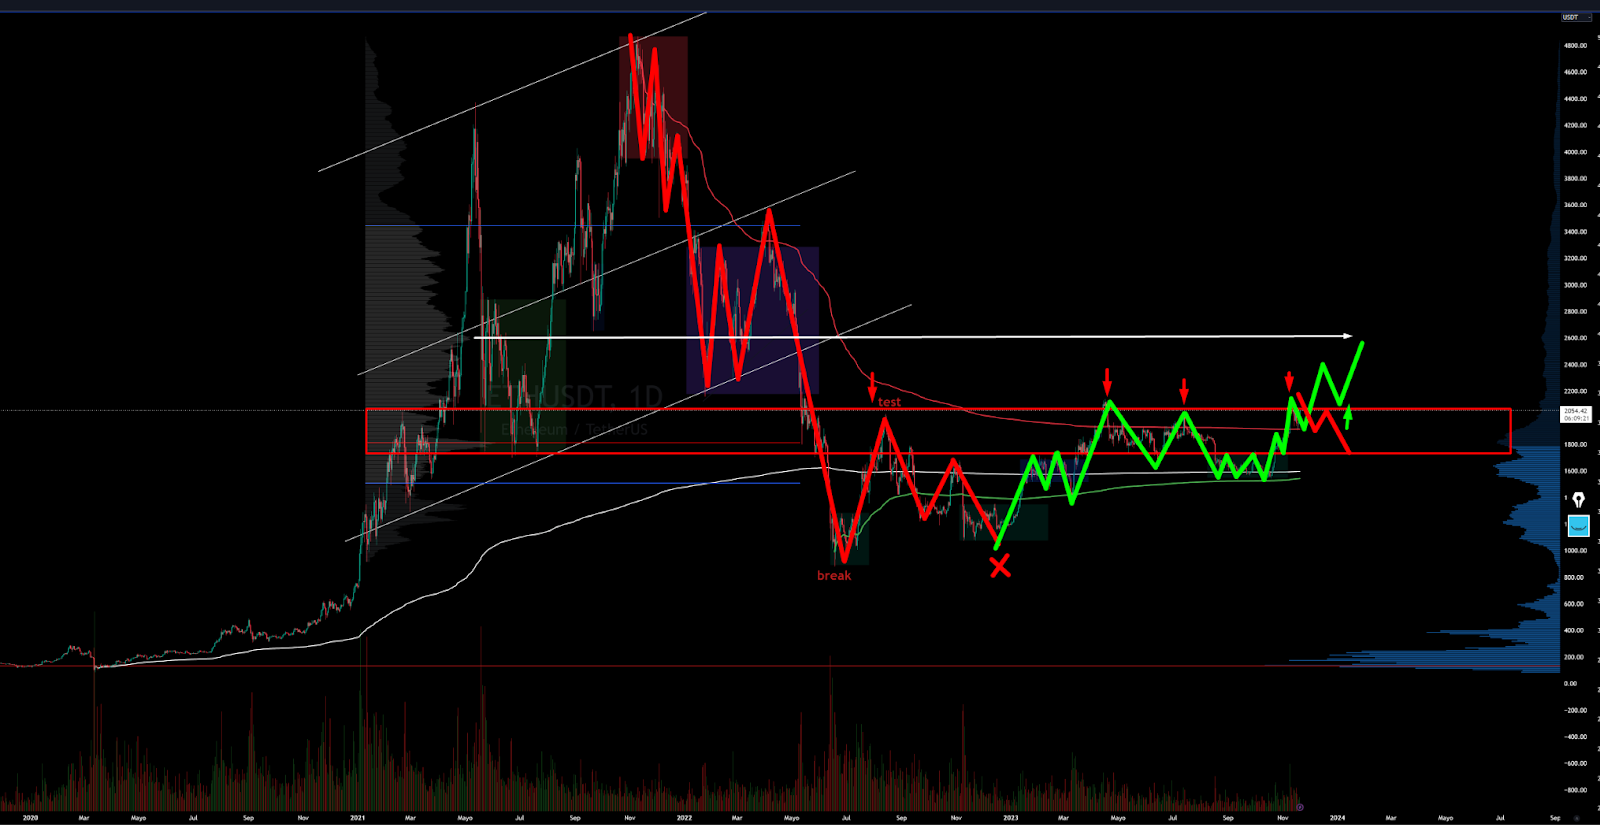
Ethereum 2711/23 4h chart

BNB
We will closely monitor the evolution of BNB as a measure of risk perception. BNB is the cryptocurrency coin that powers the BNB Chain ecosystem. BNB is one of the world's most popular utility tokens and it is used primarily to pay transaction and trading fees on the Binance exchange. It is Binance's flagship token and Binance itself is an important barometer of the broader industry’s health.
Crypto market data provider CCData linked the positive reaction to the end in uncertainties that had bogged down the crypto behemoth. It stated that the trading volume for BNB spiked to $13.8 million in the first hour after the story broke from just $1.3 million in the previous hour. However, when the news of CZ’s resignation and his pleading guilty to charges arrived, the confidence of BNB holders was shaken. Sell-offs ensued and BNB collapsed to $227 on 22nd November, losing 14% of its value.
From a price dynamics point of view, BNB has left a very ugly rejection in the area coinciding with the Vwap anchored at the previous relevant lows (green) and the Vwap anchored at the previous relevant highs (purple). We believe that such rejection may lead the price to look for those previous lows mentioned above.

AMBCrypto confirmed the above observation with DeFiLlama and found $1.31 billion in net outflows from Binance over the past week. This meant that more assets were withdrawn than deposited on the exchange. Customers’ willingness to move their assets out signaled a trust deficit with the exchange. Aside from concerns about stability, the stigma of violating government regulations weighed strongly on public opinion.

Having said that, it was important not to equate Binance’s current situation with the collapse of FTX [FTT] exchange last fall. CCData recalled that during the FTX crisis, approximately $1 billion in Bitcoin outflows were observed in under an hour on Binance alone.
CCData’s research showed that market makers withdrew liquidity on 21st November, fearing price volatility. However, the largest drop of nearly 30% after the DOJ's official indictment.

Classic markets
Stock prices continued to grind higher the day before Thanksgiving in what is becoming one of the best Novembers on record for the SP500. The famed and sought-after Santa Rally has come before December even starts. Soft Landing has again become the consensus view and risk assets prices have soared this month. Investor confidence is rapidly rotating from what was a depressed level in late October, and money is starting to flow back into risk assets. Retail and institutional investors scramble to catch up with top-heavy benchmark indexes that have left the performances of most portfolios behind.

This is a great reminder that most of the market has had a pretty terrible year even though the magnificent seven have doubled. The Magnificent Seven stocks are 30% of the SP500, a record concentration.
Market Cap
Magnificent Seven = $11.9 trillion
"Other 493" = $27.8 trillion
SP500 = $39.7 trillion
Below, the SP500 year-to-date returns are split between the "Magma 7" and the "other 493." We see arguably the most concentrated rally in history. Over 12% of the SP500's gain has come from seven stocks. ~3% from the "other 493."

Magma 7 up over 100% YTD and Micro-cap stocks (the bottom half of the Russell 2000) are DOWN 7%.

However, being sincere and analyzing the market in depth this “rally” has been driven by mechanical positioning and flows, and have now stopped. There is a high risk that the entire November rally will be given back as these forces would swing back in the opposite direction.
The rally has been a 3-part move primarily due to a market in a net short gamma position, systematic flows, and volatility selling. These are primarily a function of flows and positioning and have nothing to do with improvement in the fundamental outlook for the economy or earnings growth. This is important because mechanical flows are subject to swift and sudden shifts. Those sudden shifts could start this week, with Treasury auctions back, Jay Powell speaking ahead of an FOMC blackout period, and credit spreads approaching a key level, which could start the unwind of the November rally.
Mechanical Forces At Work
=> Gamma Squeeze
The November rally was likely due to a sudden and sharp shift in options market positioning following the Treasury Refunding announcement that sent rates lower on November 1st. This initiated a short covering rally in the options market due to an extreme negative gamma regime.
Net gamma's position in the SP500 reached its most negative point over the past year towards the end of October. When the broader market is net negative gamma, it means that market makers are sellers of the SP500 as the market moves down and buyers of the SP500 as the market moves higher. This triggered that very sharp and violent move in the SP500 starting November 1st because, at that point, the 10-year Treasury was near 5%, and the SP500 was selling off with rising rates. However, the Treasury Refunding announcement sent rates lower and stocks higher and started this mechanical process.
The data also shows us that currently, we have entered a positive gamma regime, and that means that market makers become sellers of strength and buyers of weaknesses, which helps to suppress volatility and, more importantly, means that any move higher in the SP500 is likely to be in the form of a slow grind.
Gamma Exposure SPX

=> Systematics Flows
Additionally, after the initial surge, the next wave of buying was triggered by systematic funds, which helped to create that mechanical movement in the index. However, the explosive part of the rally started to slow down as we moved into mid-November because the short-covering aspect ended, and the systematic aspect began.
However, data from Goldman Sachs now shows that the systematic flows that helped to drive the market higher off the initial short-covering surge have died out. If, for some reason, the market should start moving lower, it could result in these systematic funds flipping back and becoming sellers again in a down market.

=> Volatility Selling
It is important to remember what started the move in the equity market was due to a plunge in yields. Suddenly, rates may be coming back into focus and are beginning to show some signs of life after bouncing back this past week, especially on the long end of the curve with the 10-year moving up again.
The VIX saw its lowest close on January 17, 2020. This is odd because, arguably, this is a different moment than January 2020, which was pre-pandemic when inflation rates were lower. The Fed was cutting rates due to slowing growth while also starting to buy bonds again to increase reserve balances.

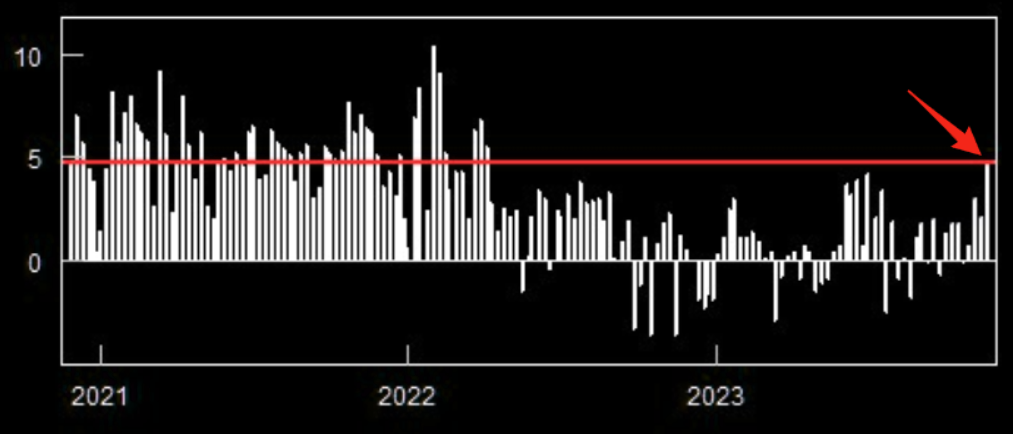
The collapse in implied volatility is not in isolation because credit spreads have fallen while financial conditions have once again begun to ease. These past few weeks have seen the CDX High Yield Index fall back to 400 and is at a point where it will have to collapse along with financial conditions completely or turn around and start pushing higher again.

VIX oscillates with changes in high-yield credit spread.

All of this comes at an interesting point because this week, Treasury auctions will be back, with the Treasury selling $54 billion 2-year notes and $55 billion 5-year notes on November 27th. The Treasury will sell $39 billion of the 7-year note on November 28th.
The auctions have been a source of volatility for the markets overall. The 30-year auction on November 9th did not go well, and now it was just the 10-year TIP auction on November 21th that did not go well, with the high yield coming in at 2.18%, above the when-issued rate of 2.145%.
It also comes during a week when Jay Powell will speak on December 1st in a fire chat, ahead of the blackout period for the December 13th FOMC rate decision meeting, as financial conditions have eased back to the level last seen before the September FOMC meeting, based on the Goldman Sachs Financial Conditions Index.
Powell and the Fed minutes already clarified that tighter financial conditions could substitute for rate hikes if persistent. However, financial conditions have not been persistent and have given back more than 60% of the tightening witnessed since July.

The mechanical bid in the stock market, which helped to ease financial conditions and bring the markets back to this point, has caused the rest of the participants to fall back on the softlanding narrative and desperately chase the price in FOMO mode. But if rates due turn higher, and financial conditions begin to tighten, then it wouldn't take much of a move in the SP500 to shift the index back into negative gamma and trigger the systematic flows to flip back from buyer to sellers, implied volatility to rise, and credit spreads to widen, to unwind much of, if not all of the rally off the October 2023 lows.
The mainstream coverage has shifted again its narrative fast towards a soft landing. Bye bye "recession", Hello "soft landing".

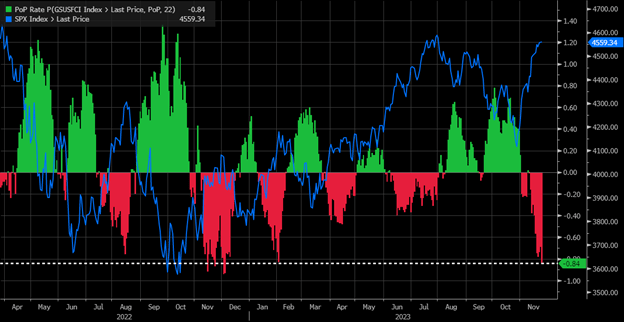
Sentiment and exposure metrics: extreme readings, all in!!
The rally has been a 3-part move primarily due to a market in a net short gamma position, systematic flows, and volatility selling. These are primarily a function of flows and positioning and have nothing to do with improvement in the fundamental outlook for the economy or earnings growth. However, the rest of the market participants have fallen into the trap of chasing the price without buying anything other than the fear of missing out (FOMO).
According to BOFA, corporate client buybacks accelerated the past two weeks and are tracking above seasonal levels for a second week in a row.

Over the last 2 weeks CTAs have bought nearly $70bn of US equities, this is the largest 10 days buying we have on record. CTAs are going to start running out of steam, in fact, trend-following funds are now as likely to go short as they are to chase higher.

According to Goldman Sachs, CTAs are now sellers of SPX in every scenario over next week.

To CTAs and buybacks we can also add retail investors, stocks experienced the biggest 2-week inflow since Feb '22 $40bn.

With inflows into tech stocks the biggest in the past 12 weeks.

Retail investors net bought +$4.8bn of cash equities this past week, +2.3 standard deviations above the last 12 months average and the highest weekly inflow recorded since April 2022.
The positioning of asset managers and leveraged funds on the Nasdaq is now at the highest level since 2017.

Hedge funds, who were record short coming into November, have now been massively punished for their net short exposure, and are about to turn net long, suggesting that the next fade move is lower.

Hedge funds betting on a decline in US and European stock markets have suffered an estimated $43bn of losses in a sharp rally over recent days.

The spread between AAII bulls vs bears has continued to move even higher. The change in sentiment from a few weeks ago is extreme.

The latest AAII survey shows investors are predominantly bullish and few bears are left.

We are approaching extreme greed territory rapidly.


Options, Gamma, IV, SKEW
The cost of protection is near lows looking out five years due to low level of hedging and Volatility selling strategies. Extremes don’t last forever in markets.

Very few are thinking about longer term protection these days, but the cost of a 80% strike put is at the lowest levels in modern times for SPX and SX5E (eurostocks)

Chasing stocks and puking downside protection (skew down) has been the story over the past month and most likely since the October 2022 low. Note that previous occasions over the past months where skew has reset sharply lower has led to the SPX reversing lower.

However, the lagging effects of monetary policy are about to start impacting financial markets. With a 2-year lead, changes in Fed funds rates have often foreshadowed significant volatility events in equity markets. The current narrowing leadership in the stock market, coupled with numerous recession indicators sounding alarms, supports the argument that volatility is currently unsustainably suppressed.
Our view is it will be difficult for vol to reset significantly lower from here.

SPX 3 month implied correlation is in its 4th percentile vs the past 10 years.


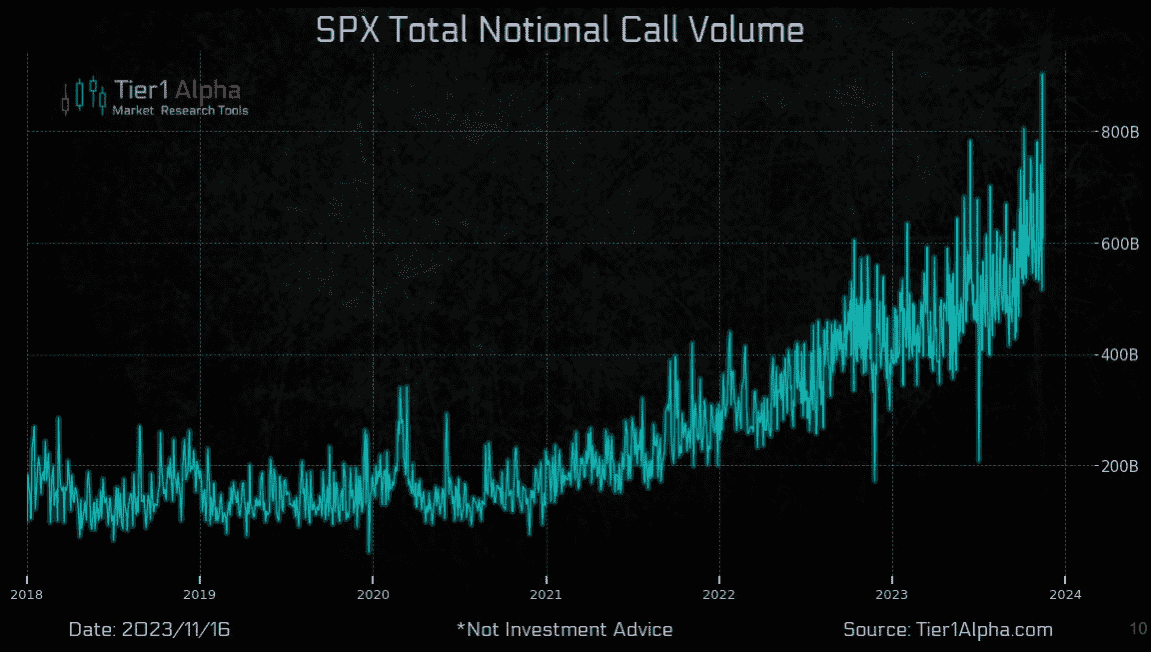
US Equity Call Volume at an All-Time High. The mother of all bubbles is back once again. FOMO chasing has sent call options to new highs.
Gamma
Trading action in the SPX was dramatic during last week, as the index got pinned by the large gamma strike at 4,550 and was unable to advance further into a very gamma-rich zone, due to a lack of demand from a larger buyer (like systematic strategies) and a Wall Street that going into holiday mode.
Realized and implied vol continues to collapse under the weight of the long-gamma regime. What happens in a long-gamma environment; dealers are constantly forced to hedge their portfolios against the market trend. This has the effect that liquidity is injected into the market/volatility is decreased.


At the start of this week we remain with a monster positive GEX and with 4600 as the main Gamma call wall, very remarkable above any other strike. In a positive gamma regime the market will find strong resistance at 4600 and support at 4515. However, It wouldn't take much of a move in the SP500 to shift the index back into negative gamma (Flip point at 4520) and trigger the systematic flows to flip back from buyer to sellers, implied volatility to rise, and credit spreads to widen, to unwind much of, if not all of the rally off the October 2023 lows.


The prevailing FOMO and internal market mechanics has succeeded in making the options market believe that there is no risk, note the total absence of gamma exposure on the OTM put side. There is no higher risk situation in which the risk is not perceived. The market is clearly swimming naked, ignoring tail risk as it has never done before.

Market Comment
Bear market rallies are notoriously violent and abrupt. And this last one was among the most violent and abrupt of them all. There is no greater risk situation in which the risk is not perceived. Although the reader may think that the November rally is due to a real show of buying strength, unfortunately this is not the case. It is not how far the market is able to go but how it has done it.
In terms of auction and market structure, November is the best example of an aberration. We are firm in our opinion that all this upside movement initiated at the end of October does not respond to a healthy and well auctioned market. The following chart shows how the volume profile for the month of November presents a disastrous auction, full of gaps and inefficiencies. We believe that sooner or later all of this will be fully repaired.

The key for the week will be the current month's VPOC at 4522 points on the SP500 future coinciding with the lower gamma call wall at 4515. If sellers manage to break through this zone, the market will enter a negative gamma regime to face a no-trade zone on the latest inflation data. All of this opens a window of severe downside risk.
On the contrary, if buyers manage to hold and consolidate above the current monthly Vpoc a test to the July highs could be possible but in a very slow and sluggish way, as the market has a really high positive gamma exposure.
ES_F 4h chart 20/11/23

ES_F 4h chart 27/11/23