.png)


.png)
Summary
The debt ceiling agreement clinched by House Republicans and the White House late Saturday was the culmination of mad-dash negotiations over the course of the past week. President Joe Biden urged Congress to pass the tentative debt limit deal he reached with House Speaker Kevin McCarthy remarks from the White House Sunday evening. "That agreement now goes to the United States House and to the Senate. I strongly urge both chambers to pass that agreement," the president said.
But the marathon is far from over, and there is little certainty the nation will avoid a default as both parties work to rally support around the package. The debt ceiling is rumored to not be raised by a specific amount, instead, the debt ceiling will run uncapped until January 1st, 2025. This means that the debt ceiling is basically unlimited for the next one and half years.
Relatedly, alongside the debt ceiling negotiations, the signal event in the week may have been Thursday’s 24% jump in the shares in chipmaker NVIDIA, which took the company’s market capitalization to roughly USD 963 billion by the end of the week and made it the sixth most highly valued public company in the world. Shares rose after the company beat consensus first-quarter earnings expectations by a wide margin and raised its profit outlook.
While stock markets were broadly flat this past week, one sector stood out in that it was up over 4.0% for the week: information technology. In fact, the technology sector is one of just three sectors in the S&P 500 Index that is positive year-to-date, along with consumer discretionary and communication services. Technology and communication services are now up over 30% this year already, well into bull-market territory. Meanwhile, each of the other eight S&P 500 sectors is negative this year thus far, perhaps reflecting the uncertainty around the ongoing U.S. debt-ceiling standoff, future path of Fed rate hikes, and potential economic softness.
The market rallied sharply on Friday despite some of the worst inflation data we have seen this year. PCE inflation increased for the first time since October 2022 and previous data was revised higher. One day later, a debt ceiling deal has been reached. The market knew this deal was coming.
As we look past the U.S. debt ceiling, the next market catalyst on the horizon perhaps lies in the June 14 Federal Reserve meeting. In recent weeks, several Fed officials have indicated that the Fed's focus remains squarely on fighting inflation, which remains too elevated for comfort. Despite better trends in headline inflation, PCE (personal consumption expenditures price index) inflation data last week moved higher, and services inflation remains persistent, driven by a solid labor market and still-elevated wage growth.
We will get critical economic data ahead of the June 14 meeting, including a U.S. nonfarm jobs report and CPI inflation data for the month of May, both of which are expected to show some cooling and could help determine the next move in interest rates.
The crypto market has decided to end May as one of the least eventful months in its history. Notably, the past week has been another drab period for most assets. Even the market capitalization remained at broadly the same value, increasing by only $6 billion. Several prominent crypto projects will be unlocking tokens this week. The move could have an impact on token prices.
Bitcoin was trading sideways for most of last week, as it was stopped at $27,500 on a few occasions. The last one drove the asset south hard as it dipped to under $26,000 for the first time in two weeks. On news that the US government had finally struck a deal on the debt limit, BTC jumped by ove a grand and neared $28,500, which became its highest price tag since May 8.
Macro and news

Debt ceiling
Debt ceiling negotiations resumed after President Joe Biden returned from Japan at the start of the week, but markets headed downward as signs emerged that little progress was being made. The S&P 500 Index fell 1.1% on Tuesday, its biggest drop since the start of the month, following reports that some Republicans in the House of Representatives were questioning the urgency of the deadline set by U.S. Treasury Secretary Janet Yellen for when the government would become unable to meet its obligations.

On Thursday, the Federal Reserve released revised data showing that the Treasury’s General Account had dwindled to $49.5 billion by Wednesday, $18.9 billion less than a week before and $ 752.2 billion below its level a year ago.
Signs of renewed momentum in the talks seemed to spur a market rally on Friday, however. The Wall Street Journal reported that the two sides were nearing a two-year spending deal that also extended the debt ceiling over the same period.
Since 1960, the debt ceiling has been raised 78 times in the U.S., including 20 times since 2001 alone. The Treasury Department has had to use extraordinary measures in six of these standoffs before Congress was able to reach an agreement.
Summary of debt ceiling deal:
1. Debt ceiling to be raised for 2 years
2. Cuts spending by $50 billion
3. $10 billion of new IRS funding clawed back
4. No budget caps after 2025
5. No new taxes or government programs
6. Boost in defense and VA spending
7. Domestic program spending frozen for one year
This deal was agreed to “in principle” with still “a lot of work to do” according to Speaker McCarthy. Spending cuts are just 0.2% of GDP.
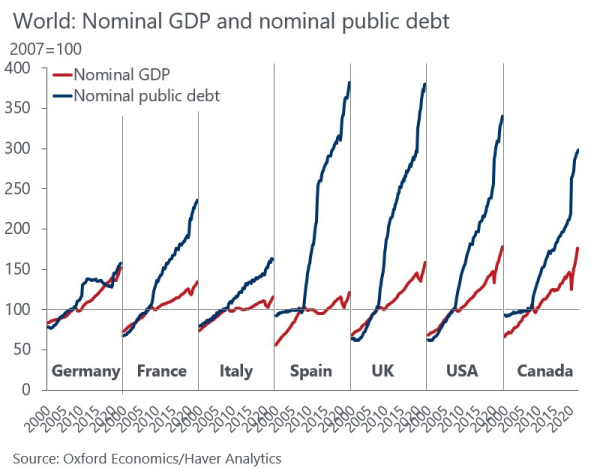
The US has added $8 trillion in federal debt since 2020, now at a total of $31.5 trillion. To put this in perspective, it took the U.S. 227 years to add the first $8 trillion in debt. With the new debt ceiling bill, the debt limit will be uncapped until 2025. Some estimates show $4 trillion in debt will be added by 2025 at this rate. If a recession hits or a "stimulus" event takes place, we could easily be near $40 trillion in federal debt. 25% of all government revenue would go toward interest expense.
The most ironic part of the debt ceiling deal is that it will literally accelerate the federal debt crisis. With an uncapped debt ceiling for 19 months, there is unlimited borrowing capacity. Conservatively speaking, federal debt will cross $36 trillion by 2025. The debt ceiling deal will ironically add record levels of debt, which is the real big problem.
US national debt
1st of January, 2000: $5.7 trillion
1st of January, 2010: $12.3 trillion
1st of January, 2020: $23.2 trillion
Now: $31.5 trillion

Debt ceiling deal done, and now…?
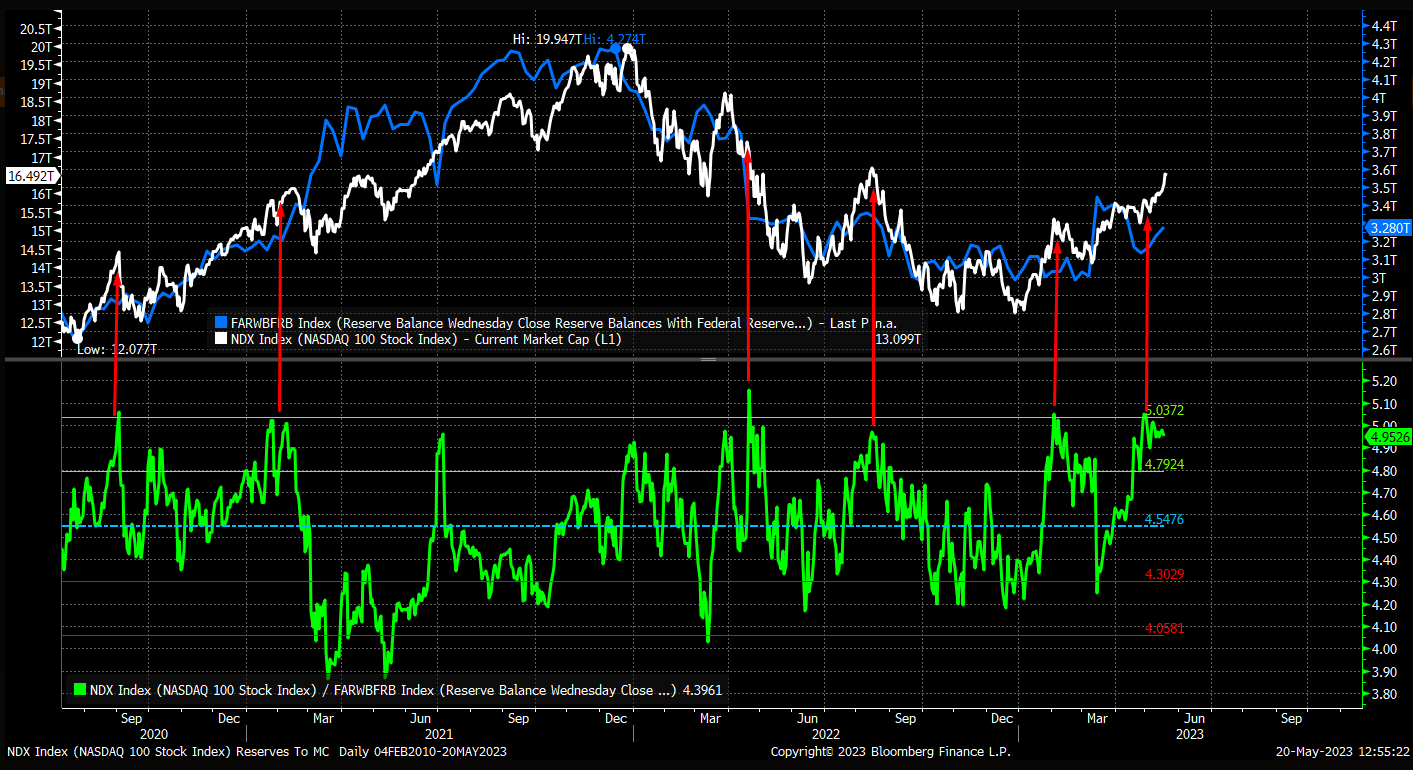
The debt ceiling deal is NOT risk positive. An agreement means the Treasury will be able to refill the Treasury General Account (TGA), this will suck a tremendous amount of liquidity out of the markets. Last time Fed was doing QE to mask TGA refill, now they’re doing QT + bank reserves -25% YoY already = fragility growing.

Since the conclusion of quantitative easing (QE), changes in the Treasury General Account have significantly impacted the size of reserve balances. By examining an inverted chart of the TGA compared to the NASDAQ 100, one can observe that fluctuations in the TGA influence the equity index. The recent decline in the TGA has been caused by a weak tax season and the debt limit issue. Due to the decrease in the TGA, equity prices have remained elevated and even experienced a slight rally over the past week.

One reason why the equity market hasn't extended further over this period is that the size of the Fed's balance sheet has been shrinking again, and to some degree, that has been neutralizing some of the effects of the declining TGA account.

The Fed balance sheet briefly expanded following the collapse of SVB, as banks accessed the Fed's discount window, which gave reserves a big boost, helping to lift equity prices. Additionally, the decline in the TGA helped to free up even more reserves. But now that the usages at the discount window are declining and the Fed balance sheet is shrinking, reserves have started to decline again. If the Fed's balance sheet continues on a path of QT, the size of the balance sheet will continue to decline; as the Treasury begins to rebuild the size of its account held at the Fed, this should result in the reserve balance declining again.
Generally speaking, the Nasdaq market cap has traded between 4 to 5 times the size of the reserve balance and is currently trading at the upper end of that range at 4.95. The last few times the ratio had gotten this high was in late March 2022, August 2022, and February 2023; each of those times ended with a substantial decline thereafter.
Debt world
Current U.S. Debt Levels:
1. Household Debt: $17.1 trillion
2. Mortgage Debt: $12.0 trillion
3. Auto Loans: $1.6 trillion
4. Credit Card Debt: $986 billion
5. Total student loan debt: $1.6 trillion (student loan payments are set to resume this summer)
(All of these balances are at a record high)

Current Interest Rates:
1. Credit Card Debt: 25%
2. New Car Loans: 14%
3. Used Car Loans: 9%
4. 30Y Mortgage: 7%
Eurozone macro data
European government bond yields broadly climbed on concern that central bank policymakers would extend their policy tightening to cope with persistent inflationary pressures. The yield on the benchmark 10-year German government bond settled above 2.5%. Spain’s and Italy’s sovereign bond yields also rose. In the UK, robust core inflation data fueled a broad sell-off in the bond markets, with the yield on the benchmark 10-year UK government bond heading toward 4.3%.
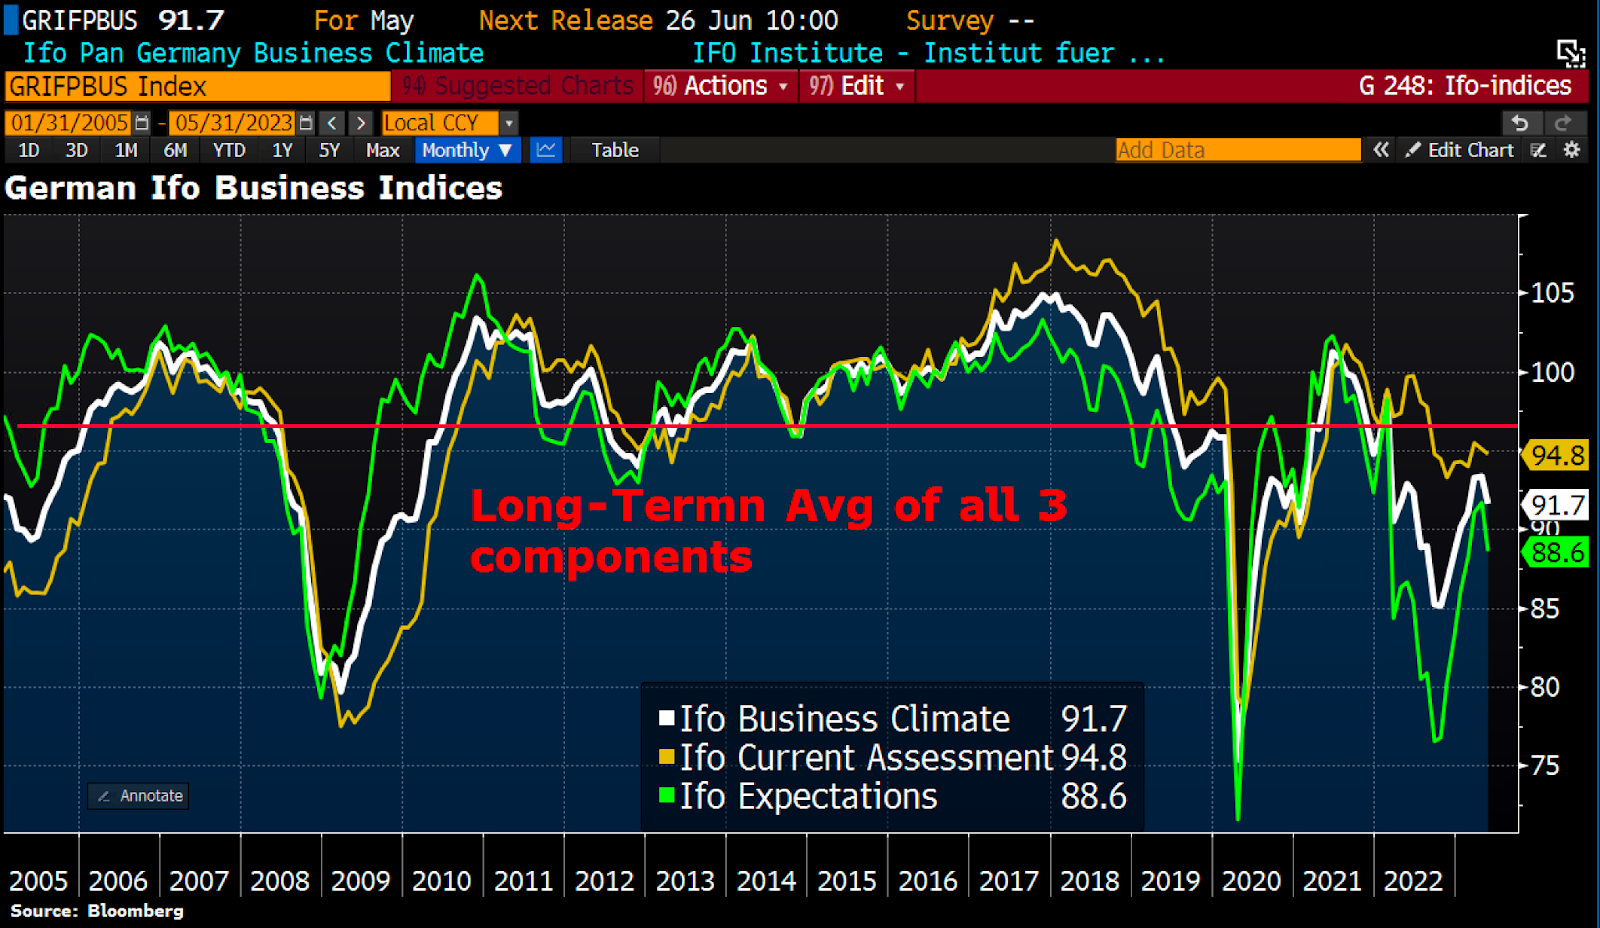
The German economy lapsed into recession in the first quarter, according to official figures. Gross domestic product shrank 0.3% in the three months through March, a downward revision from an early estimate of zero growth that reflected a sizable drop in household consumption. Germany’s economy contracted 0.5% in the final three months of last year.

Meanwhile, German companies became more uncertain about the year ahead, with the Ifo Institute’s business confidence index falling in May for the first time in seven months.
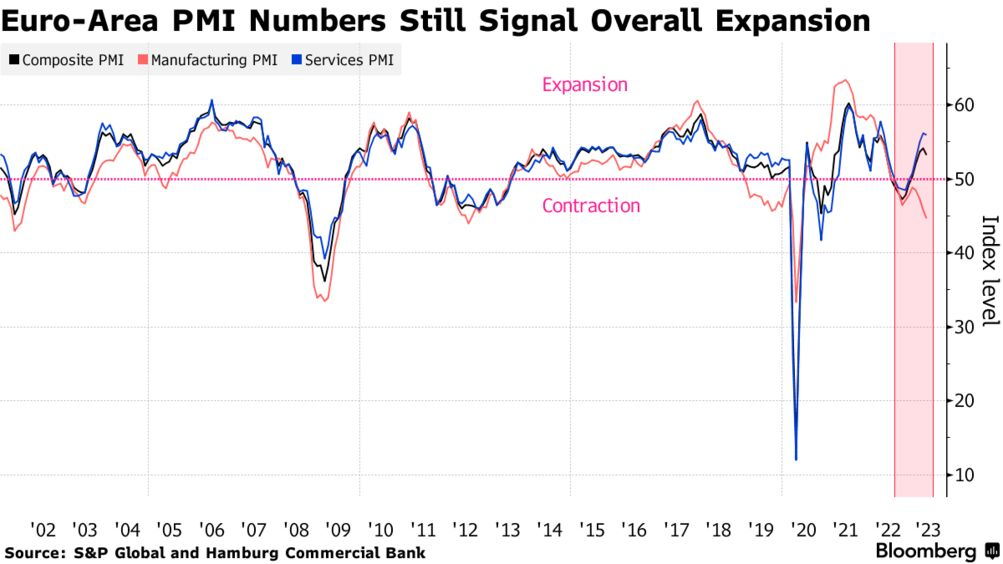
Eurozone PMI expands for fifth straight month, but optimism weakens. A survey of purchasing managers compiled by S&P Global showed that business output in the eurozone grew for the fifth month running in May, although the pace slackened somewhat as weakness in manufacturing offset another strong month of services activity. Optimism about the economic outlook slipped further from February’s 12-month high amid increasing concern about weaker customer demand and higher interest rates.
UK macro data
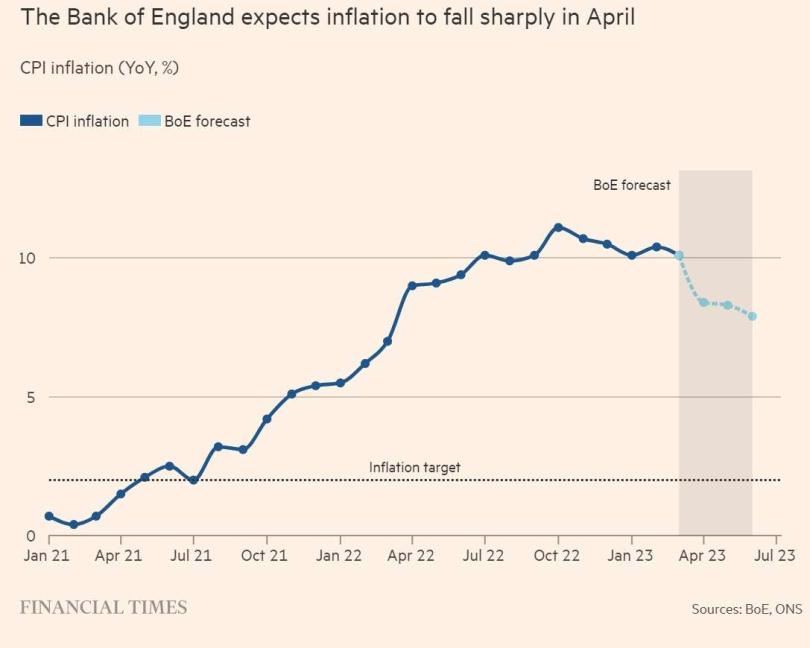
Inflation slowed in April to an annual rate of 8.7% from 10.1% in March, as the surge in energy prices that occurred last year fell out of the annual comparison. However, core inflation, which excludes volatile energy, food, alcohol, and tobacco prices, rose to a 21-year high of 6.8% from 6.2%. The result fueled market expectations for a 13th consecutive interest rate hike in June.


U.S Macro data
The core (less food and energy) personal consumption expenditures (PCE) price index, considered the Federal Reserve’s preferred inflation gauge, rose by 0.4% in April, a tick above expectations. On a year-over-year basis, the index rose by a notch to 4.7%, indicating no progress in bringing inflation down since the start of the year.
This is a major setback to the Fed's fight against inflation, first increase in PCE inflation since last October.


The Commerce Department reported that personal spending had jumped 0.8% in April, roughly double consensus expectations and supported by increases in spending on both goods and services.
The signs of a resilient consumer and persistent inflation pressures led to a jump in short-term U.S. Treasury yields, with the yield on the two-year note hitting its highest level in over two months. Reflecting debt ceiling worries, the yield on the one-month Treasury bill hit 6.02% at the end of the week, its highest level since its introduction in 2001.
Interest rate expectations are shifting rapidly, 2 weeks ago, no more rate hikes were expected. Now, there is a 70% chance of at least 2 more hikes. Interest rate futures now pricing in a 25 bps rate hike in June after PCE inflation unexpectedly rises.
There is now a 57% chance of a June rate hike and a 27% chance of another hike in July. Interest rate cuts are now not expected to start until November. Only 1 rate cut is expected for the entire 2023, while 4 cuts were previously expected.

The yield of the 10 year U.S. Treasury bond rose for the second week in a row, climbing to the highest level in two and a half months. The 10-year bond closed around 3.80% on Friday, up from 3.46% a couple weeks earlier, yet well below a recent peak of 4.07% on March 2.

The next market catalyst on the horizon perhaps lies in the June 14 Federal Reserve meeting. In recent weeks, several Fed officials have indicated that the Fed's focus remains squarely on fighting inflation, which remains too elevated for comfort. Despite better trends in headline inflation, PCE (personal consumption expenditures price index) inflation data last week moved higher, and services inflation remains persistent, driven by a solid labor market and still-elevated wage growth.
For several weeks it looked like initial jobless claims were finally trending higher, suggesting the eager-awaited weakening of the U.S. labor market had commenced. But a strong number last week and significant downward revision the week before paint an entirely different story. In recent weeks, initial jobless claims are trending down again.

The Fed is likely leaning toward a pause in rate hikes for now, particularly given recent uncertainty in the regional banking sector and some tightening of credit conditions, but any decision will likely be highly data dependent from here. We will get critical economic data ahead of the June 14 meeting, including a U.S. nonfarm jobs report and CPI inflation data for the month of May, both of which are expected to show some cooling and could help determine the next move in interest rates.
Fed split, FOMC minutes
Minutes released on Wednesday from the most recent policy meeting of the U.S. Federal Reserve showed that officials were divided as to whether another interest-rate increase will be needed when they meet again on June 13-14. At their early May meeting, some officials said they expected that an economic slowdown would remove the need for another rate hike, while others suggested another increase is likely.
Summary of fed meeting minutes (5/24/23):
1. Fed sees "uncertainty" over further rate hikes
2. Debt default threatens tighter financial conditions
3. Fed sees "mild recession" in late-2023
4. Inflation is still "unacceptably high"
5. Additional policy firming may be appropriate
China macro data
Chinese stocks fell after a batch of disappointing indicators in recent weeks pointed to a flagging economic recovery. The benchmark CSI 300 Index fell 2.4%, its biggest weekly drop since the five days ended March 10 and erasing all its gains this year.
No major indicators or policy measures were released in China during the week. But mounting evidence that the country’s post-pandemic recovery is losing momentum has raised concerns about the economic outlook. Most recently, industrial output, retail sales, and fixed asset investment all grew at a weaker-than-expected pace in April, while weak credit growth indicators also pointed to sluggish domestic demand.

Crypto News
On the political front, discussions around central bank digital currencies (CBDCs) continue to shape and define the larger narrative of cryptocurrencies. Florida Governor Ron DeSantis, a candidate for the Republican Party leadership, has voiced a robust stance on cryptocurrencies during a conversation with Elon Musk and venture capitalist David Sacks. Taking a strong position against CBDCs, DeSantis made it clear that his advocacy for bitcoin springs from a place of safeguarding civil liberties.
The RBA has shown an active interest in CBDCs, launching research projects and pilots to explore the feasibility and implications of a potential digital Australian dollar. The developments in Florida and the RBA’s efforts highlight how conversations around CBDCs are not confined to one corner of the globe, but are part of a worldwide dialogue on the future of cryptocurrencies and the larger financial ecosystem.
Sam Altman, the CEO of OpenAI, successfully closed a $115 million funding round for his crypto-focused project called Worldcoin. The creator of ChatGPT is now looking to foray into the field of cryptocurrencies.
MATIC Addresses on Polygon Explode to 2-Year Highs: Data. The growing adoption of proof-of-stake is reflected in a considerable shift in the industry. While Ethereum seems to be dominating the conversation, Polygon saw an explosion of MATIC addresses to a 2-year high.
Cryptos: spot, derivatives and “on chain” metrics
Bitcoin was trading sideways for most of last week, as it was stopped at $27,500 on a few occasions. The last one drove the asset south hard as it dipped to under $26,000 for the first time in two weeks. On news that the US government had finally struck a deal on the debt limit, BTC jumped by ove a grand and neared $28,500, which became its highest price tag since May 8.
From the technical aspect, the Vwap anchored at the lows of the bullish impulse continues to act as support. Following the news of the debt ceiling deal, Bitcoin has managed to break the Vwap marked in green, which was acting as resistance. Demand must achieve an effective imbalance of the minor structure shaded in blue and conquer the high volume node (HVN) of $28120, which in turn also coincides with the Vwap anchored at local highs. The conquest of this HVN and this Vwap would reopen the door to a medium-term bullish scenario. Note how this Vwap anchored at local highs has acted as resistance, with clear impossibility for the demand to develop above it.
Bitcoin 22/05/23 10 min chart

Bitcoin 29/05/23 10 min chart

Bitcoin 22/05/23 4h chart

Bitcoin 29/05/23 4h chart

Moving up the timeframe, we are still at a key moment. Bearish imbalance or failure of the main lower value area. An imbalance is desirable to always occur above the highs of the range, any deepening of the price to the lower value could seriously jeopardize any bullish approach. In this 4-hour timeframe we could face significant changes from last week. The upper red value area may be facing a failed bearish imbalance. Demand as stated above has to conquer the HVN of $28100 and the Vwap anchored at highs to dispel the possibility of a break and test higher in 2 legs.
We are very expectant about the evolution of risk assets following the debt ceiling agreement. An agreement means the Treasury will be able to refill the Treasury General Account (TGA), this will suck a tremendous amount of liquidity out of the markets. Liquidity is probably the most important variable in these times for risky assets. This chart speaks for itself. Bitcoin vs Wresbal (Reserve Balances with Federal Reserve).

Ethereum 22/05/23 4h chart

Ethereum 29/05/23 4h chart

Ethereum is in the process of consolidating above the important zone discussed in previous newsletters. The Vwap anchored at the highs is a hard resistance zone, as seen in the chart, we would like to see a good sign of demand strength crossing this Vwap.
Classic markets
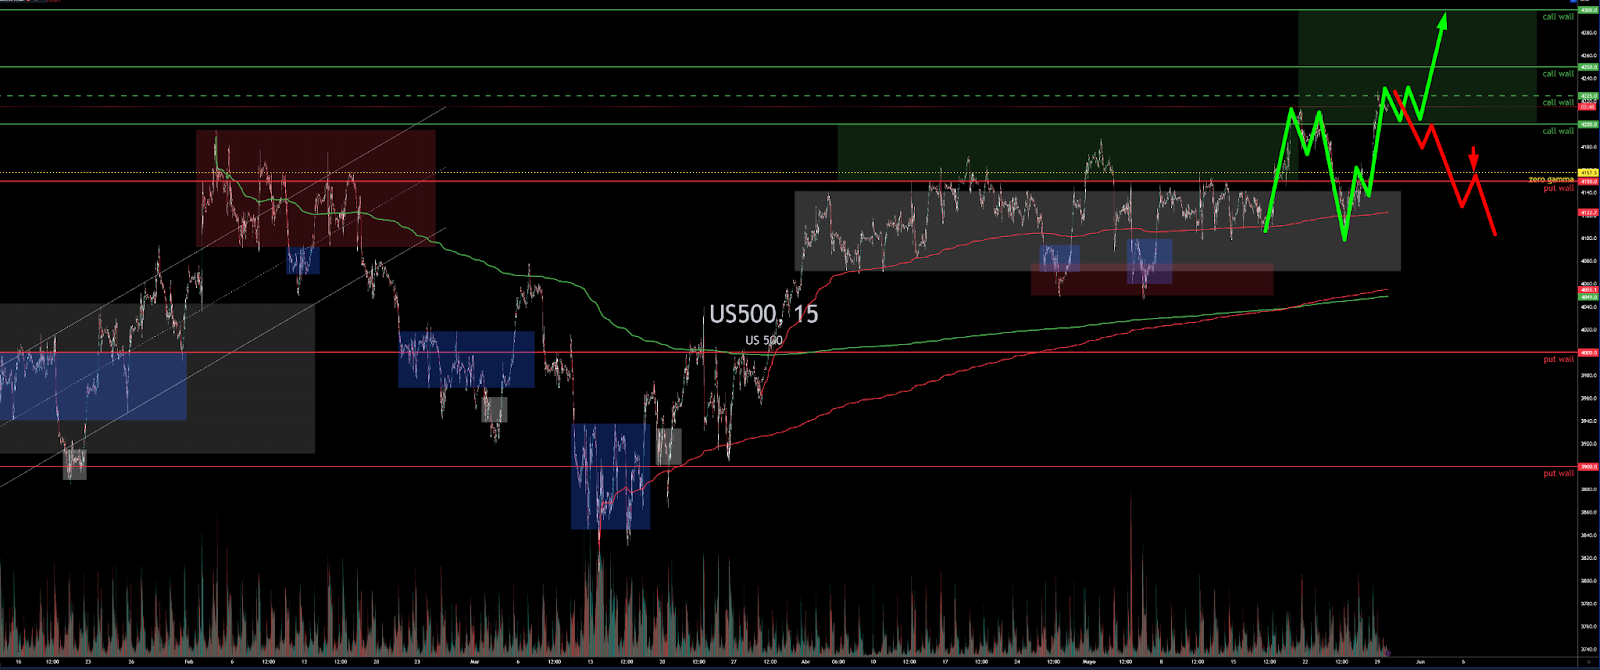
Our scenario proposed last week again has been fulfilled. We were looking for retractions after OPEX, albeit not as deep as they have been, to then push upwards again discounting the debt ceiling agreement. Once again, the Vwap indicated in the chart has acted as support, as well as the 4100 points zone, which continues to be a clear area of buying initiative. It is worth noting the V-turns of the market, a narrow range of prices with a volatility and change of bias practically intraday that in itself reflects for us a clear red flag on the market´s behavior.
16/05/23 SP500 futures big picture

22/05/23 SP500 futures big picture

29/05/23 SP500 futures big picture

Last week, due to fears over the debt ceiling agreement, we saw panic in the market and abundant hedging once again. During Wednesday and Thursday we observed abundant put hedge flow resulting in a high negative gamma exposure (GEX). The reader may wonder why such notable hedging activity if it was common knowledge that the deal was coming. These flows that dominate the markets today have an approach that is far from human logic, they are flows that enter the market systematically, mainly based on volatility parameters.
But when events change overnight they are fuel for these powerful gamma squeezes that we have been observing since last year.
Gamma Profile 24/05/22

The closing of hedges and bearish positions in the options market has been the main cause of the vigorous rally experienced by the market last Friday, despite the terrible PCE data. Remember, if the market is buying puts, the Market Makers sell those puts and their natural delta hedge is to sell futures. If market sentiment changes, those puts are burned or closed, forcing the Markets Makers to buy back their short hedges.


Before considering scenarios, it is time to take another look at the market´s gamma profile. We are back in a positive gamma regime where the Market Makers provide liquidity as they sell the tops and buy the dips to cover their books. We note that the strike with the highest gamma notional is 4300, coinciding with the call sold by JP Morgan in its monster collar trade, which expires on June 30. According to this weekly snapshot, the market should remain stable between 4200 and 4300 points, and as the expiration of this collar trade approaches, it should begin to experience serious difficulty moving higher, as gamma tends to peak the closer to expiration. Remember, if JP Morgan sells the call option, the market maker is long gamma and must cover by selling futures.
Gamma Profile 22/05/22

Gamma Profile 29/05/22

However, once again, liquidity is the protagonist. A drain of liquidity, as explained in this newsletter, can give a strong setback to the upward momentum of risk assets. We will continue with a long bias but with little upside (4300 points) and we will be very aware of the market's GEX flip, currently at 4157.5 points. In our opinion, the market has no tailwind for further increases due to this liquidity issue. The risk-return ratio is at its worst now that the debt ceiling agreement has been reached.
The technology sector is one of just three sectors in the S&P 500 Index that is positive year-to-date, along with consumer discretionary and communication services. Technology and communication services are now up over 30% this year already, well into bull-market territory. Meanwhile, each of the other eight S&P 500 sectors is negative this year.

There may be a few reasons behind the recent technology outperformance. First, growth sectors were the biggest laggards last year, and they experienced the sharpest declines in valuations, perhaps making the technology and growth areas more appealing to investors looking for bargains. Secondly, many large-cap technology stocks have become part of a defensive strategy more recently. These companies have certainly shown resilience through this past earnings season, highlighting their defensible business models and strong financial positions, and returning value to shareholders through share-repurchase programs.
Many investors who are sitting on the sidelines, given the better yields from cash-like instruments, need a compelling reason to enter the markets, and the growth potential of AI technologies may be where some of this cash is now flowing.


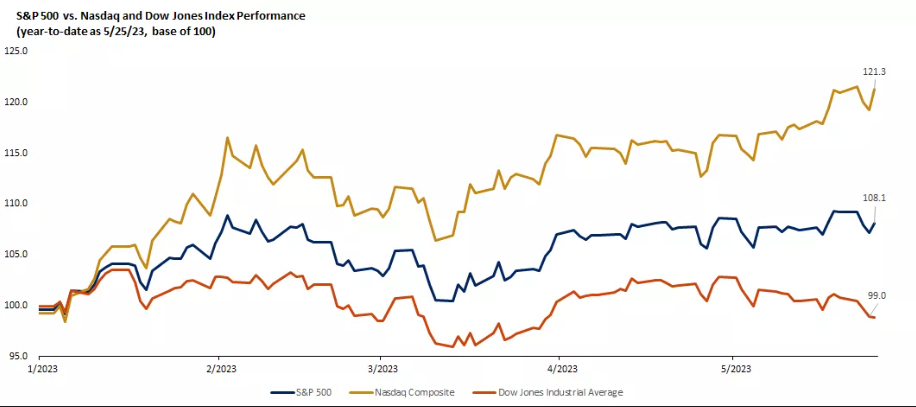
The degree of market concentration is bordering on surrealistic levels. Less than 40% of SPX companies are outperforming the index itself, as the YTD strength is increasingly tied to a small group of tech & mega-cap stocks. Current level ranks in the third percentile over the past decade.


The ratio between the Russell 2000 and NASDAQ 100 is back to an extreme we haven’t seen since the COVID crash. But this time it’s about the regionals tanking while tech rockets higher. Will this provoke a mean reversion trading opportunity with the extended short positioning and longs in tech?.

The market seems to have been reduced to 6 companies pulling the wheel.


