.png)


.png)
Summary
The major U.S. stock indexes posted weekly gains, with the NASDAQ outperforming the S&P 500 and the Dow for the fourth consecutive week. The S&P 500 rose 1.6%, allowing it to break out of the narrow range in which it had been stuck since early April. All of this was clearly driven by the monthly expiration of index and equity options (Opex). The master of the market these days is the flows deriving from options, which at expiration are even more accentuated if possible.
With many investors keeping a close eye on U.S. government debt ceiling negotiations in Washington, the yield of the 10-year U.S. Treasury bond rose to the highest level in more than two months. The bond was trading around 3.69% on Friday, up from a recent low of 3.29% on April 6, yet well below a peak of 4.07% on March 2.
In addition to tracking the latest negotiations over the U.S. government debt ceiling, many investors will be looking ahead to Wednesday’s release of minutes from the U.S. Federal Reserve’s policy meeting that concluded on May 3. The minutes could shed light on Fed officials’ recent views as to whether to pause its rate-hiking cycle or lift rates for the eleventh meeting in a row. The next meeting is June 13–14.
We leave behind a very weak week in terms of macro data but this week we have got something for everyone : Fed minutes and speakers, PMI Flash data, GDP, PCE, Consumer Sentiment, and jobless claims. Much of last week’s economic data was generally in line with consensus expectations. Retail sales rose 0.4% in April, below consensus expectations and at the slowest year-over-year pace (1.6%) since early in the pandemic. The week also brought signs of surprising resilience in the labor market. Weekly jobless claims came in at 242,000, below expectations and below the previous week’s reading of 264,000, the highest level since late 2021.
Given the Federal Reserve’s stated intention of cooling the labor market to bring down inflation, investors were perhaps primed to react negatively to some hawkish commentary from Fed Chair Jerome Powell on Friday. An early rally evaporated after Powell stressed before a Fed conference that inflation remained far too high and that officials were resolute about bringing it back to their target of 2%. Nevertheless, Powell also stated that tightening credit conditions following recent banking turmoil meant that the “policy rate may not need to rise as much as it would have otherwise to achieve our goals.
The prices of Bitcoin and Ethereum remained flat for the third week running as the United States Securities and Exchange Commission (SEC) showed no signs of conceding ground over its claim to being the industry’s lead regulator. There were no substantial losses among any of the top thirty cryptocurrencies this week.
On Tuesday, European Union Finance Ministers adopted the bloc’s Markets in Crypto Assets (MiCA) bill with no objections. This marks the final step in the process of the legislation coming into force and now means that the EU has a comprehensive and uniform set of guidelines for regulating crypto throughout its 27 member states..
Macro and news

Eurozone macro data
Official data provided further signals that Europe might be sliding into an industrial recession. Eurozone industrial production sank 4.1% sequentially in March, after rising 1.5% in February. On a year-over-year basis, industrial output declined 1.4%, after increasing 2.0% in the preceding month.
The euro zone economy grew by a marginal 0.1% in the first quarter of the year, preliminary figures showed Friday, even as Germany’s GDP flatlined over the period. The print came in below analyst expectations, with a Reuters poll of economists previously forecasting quarterly growth of 0.2%. The economy expanded by 1.3% on an annual basis, just missing an outlook of 1.4%.
In Germany, the ZEW economic research institute said investor morale fell for a third consecutive month in May. The latest German ZEW indicator of economic sentiment missed market expectations and declined to -10.7, its lowest reading since December 2022. ZEW President Achim Wambach said Germany could slip into a mild recession.
The European Commission raised its forecasts for eurozone economic growth this year and next and predicted inflation would remain stubbornly high. The latest projection calls for gross domestic product (GDP) to expand 1.1% this year and 1.6% in 2024, up from the previous forecast for growth of 0.9% and 1.5%, respectively. Wage increases are expected to drive inflation higher to 5.8% in 2023 and 2.8% in 2024, up from the previous estimates of 5.6% and 2.5%, respectively.
U.S Macro data
Retail sales rose 0.4% in April, below consensus expectations and at the slowest year-over-year pace (1.6%) since early in the pandemic. Given that the data are reported on a nominal basis and that the consumer price index rose 5.5% over the same period, inflation-adjusted spending fell sharply. Industrial production rose 0.5% in April, well above expectations for a flat reading, driven in part by increased auto manufacturing.

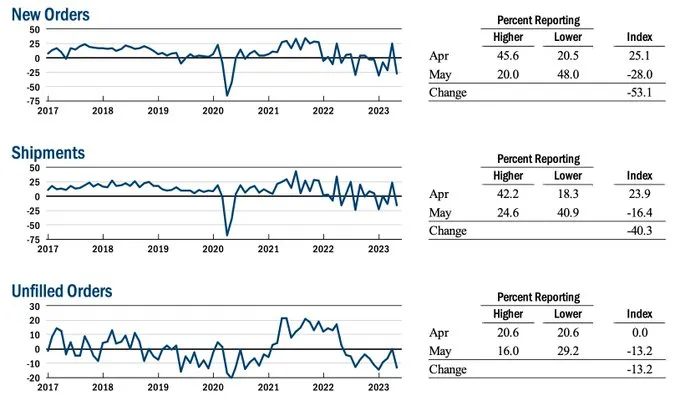
We also saw especially weak business conditions from the Empire State Manufacturing Index, which came in at -31.8 vs an expectation of -3.7.

New orders fell significantly, along with shipments, and backlogs.
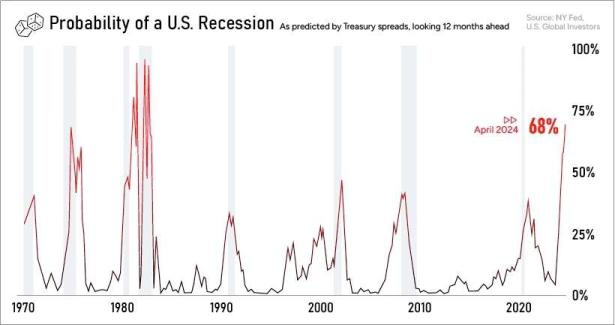
For a 13th month leading economic indicators (LEI), as measured by the Conference Board, fell again. Since 1960 anytime we’ve seen LEIs fall for 6 or more months we have had a recession, the chances of a recession this year are still elevated.

The Philly Fed Manufacturing Index has moved down to -24, its lowest level since May 2020. In the past (data since 1968), every time this indicator was at or below current levels the US economy was either in or approaching a recession.

Numerous models from different sources seem to indicate that recession is inevitable.

On a side note, since 1960, it has taken 12 years on average for inflation to slow to 2% or lower once the US consumer price index has breached 5%

We are of the opinion that the market is wrongly discounting an easing of inflationary pressures. They will undoubtedly abate, but not in the way the market is demanding.

This is the fastest money supply contraction since the 1930s.

China macro data
Chinese equities were mixed amid concerns that the country’s post-COVID recovery is losing steam. Official data showed industrial output, retail sales, and fixed asset investment grew at a weaker than expected pace in April from a year earlier. Unemployment fell to 5.2% in April from March’s 5.3%, but youth unemployment jumped to a record 20.4%.


Banking Crisis
While banks and stocks generally had a week of robust gains, the rally was trimmed on Friday when negotiations over raising the debt ceiling broke down. The U.S. banking system has been under pressure since the sudden collapse and seizure of Silicon Valley Bank by the FDIC on March 10. The challenge of analyzing bank safety is that a severe loss of confidence can actually cause an otherwise functioning financial institution to come under duress.
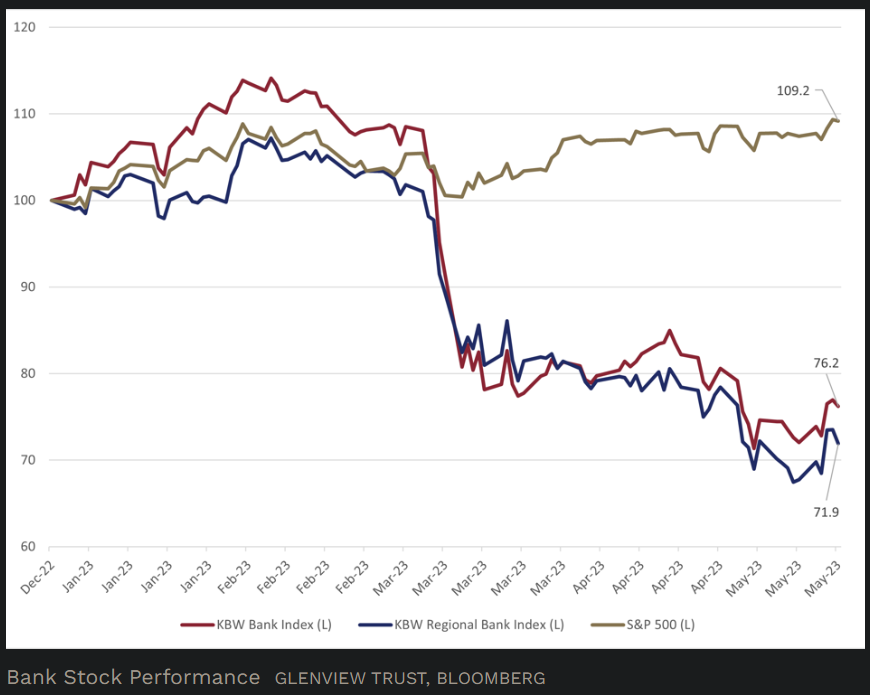
Despite the debt ceiling worries, the bank indexes outperformed the S&P 500 by a wide margin last week for the first time since the banking crisis began. The proximate cause of the sharp rally in banks, particularly the regional banks, was an announcement by Western Alliance Bancorporation that deposits had risen by over $2 billion since April. In addition, Western Alliance noted that extra liquidity would be provided by the “imminent” sale of about $3 billion in loans. Western Alliance’s stock price had been more than cut in half before a breathtaking rally of almost 25% last week.
The KBW Regional Bank index is down over 28% year-to-date. As measured by the KBW Bank index, larger bank stocks declined almost 24% year-to-date.
A straightforward way to measure the stress in the U.S. banking system is the magnitude of bank support provided by the Federal Reserve via various facilities. The most common is the discount window, which banks generally avoid, but the facility can provide emergency liquidity. In addition, following the collapse of Silicon Valley Bank, the Federal Reserve announced a new facility to help banks meet withdrawal requests from depositors and restore confidence. The Bank Term Funding Program (BTFP) allows banks to borrow up the face value of any government bonds held in the bank’s portfolio at a very reasonable rate.
Overall, the decreased Fed bank lending across its facilities for three weeks in a row evidences some healing. Still, the uptick in BTFP usage illustrates that stresses remain in the system.

Unfortunately, the banking system saw net deposit outflows across large and small banks. Notably, the 25 largest banks, which include many midsize regional banks, have lost about 1.8% of their deposit base since the failure of Silicon Valley Bank, while the smaller banks lost 4.6%.
Government money market funds saw inflows again last week at a similar pace to the previous week. Cash has been flowing into government money market funds, which confirmed the pressure on deposits to leave the banking system.

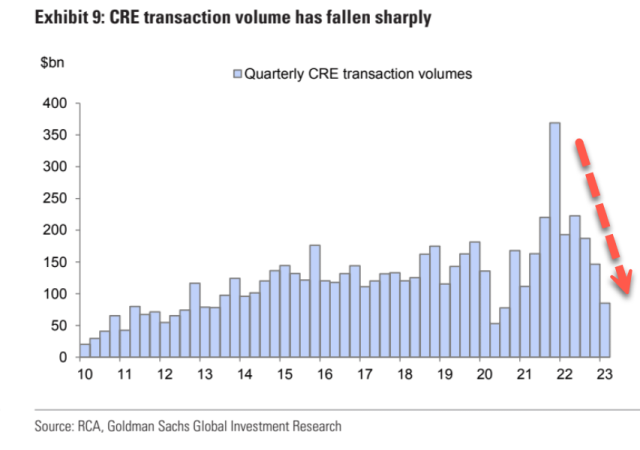
Banks have continued to make loans despite the crisis, but total bank lending declined last week, deceleration of commercial real estate (CRE) loans is notable and worrying. Most commercial real estate loans are provided by smaller banks, which are the ones most threatened by this banking crisis, so that remains an area of concern.

Credit crunch in an indebted world
Total US household debt rises by $148 billion in the first quarter of 2023, to a total of $17.05 trillion. This is the first time in history that total US household debt has crossed $17 trillion.
Breakdown of the large categories:
1. Mortgage Debt: +$121 billion to $12.04 trillion
2. Auto Loans: +$10 billion to $1.56 trillion
3. Student Loans: +$9 billion to $1.60 trillion
4. Credit Card Debt: Unchanged at $986 billion
Debt levels continue to hit new records every quarter despite the fastest rising interest rates in history. Consumers ran out of money and are using debt to "fight" inflation.


Delinquency rates are beginning to rise again, now at 2.6% nationally. However, the sharp drop in student loan delinquency came as student loan payments were halted. This summer, payments will resume for the first time since the pandemic.


Debt ceiling
The negotiations to raise the debt ceiling seemed to progress last week, but they broke down on Friday. President Biden’s absence from Washington to attend the G7 Summit in Japan has likely complicated matters, and negotiations are not expected to resume until his return this past Sunday. The good news is that both sides know time is running out, as the U.S. Treasury’s general account is running low. Since this is a negotiation with each side trying to use its political leverage, these things are usually dragged out until the last minute.
President Joe Biden and House Speaker Kevin McCarthy, R-Kevin McCarthy will meet in person at the White House later Monday to resume debt ceiling negotiations.
The principal thing to remember is that any debt ceiling crisis is a manufactured political crisis rather than a lack of ability to pay the U.S. government’s debt. This debt ceiling argument is a political fight in which each side thinks it can extract something from the other. While a possible default on U.S. debt will be discussed in the news if an agreement is not reached as extraordinary measures are exhausted, a default is virtually certain not to happen.

The more Debt they have the higher the Ceiling goes:
US national debt
1st of January, 2000: $5.7 trillion
1st of January, 2010: $12.3 trillion
1st of January, 2020: $23.2 trillion
Now: $31.4 trillion

Crypto News
=> XRP blew up 9.4% last week. The coin’s progenitor, Ripple, scored a small courtroom victory against the SEC in the latter’s ongoing lawsuit against the company for selling XRP as an unregistered security. Judge Analisa Torres blocked the SEC’s motion to seal documents linked to a speech by former SEC director Bill Hinman explaining why Bitcoin and Ethereum should not be considered securities. Torres said the documents in question were “subject to a strong presumption of public access.” Ripple’s defense previously made Hinman’s case for XRP, but the SEC countered that Hinman’s speech represented Hinman’s personal views before unsuccessfully requesting the motion to seal the documents.
Ripple made headlines again this week with the news that it has launched its Central Bank Digital Currency (CBDC) platform. The platform is pitched to central banks and governments looking to create their own centrally-issued stablecoins, alongside financial institutions that will distribute them and the users (both retail and corporate) that will trade, hold and use them.
=> SEC chairman Gary Gensler pushed back against claims that the SEC’s regulatory guidance to crypto companies was not clear. Speaking at a keynote session, Gensler insisted “the rules have already been published” and added his agency “stands ready to help them to come into compliance.” The SEC’s position is widely perceived as disingenuous because the regulator is simultaneously bombarding the industry with lawsuits.
=> ECOFIN comprises 27 finance ministers from the states in the European Union. Interestingly, all 27 finance ministers voted unanimously in favor of the MiCA legislation, bringing it a step closer to a full-scale implementation. This legislation was formally adopted by the EU on April 20.
While the EU made headway toward crypto regulation this week, the United Kingdom continued to entertain propositions. The latest proposal suggested that retail trading in unbacked digital assets be regulated like gambling. This suggestion was made by the UK House of Commons Treasury Committee.
=> South Korea’s multinational electronics firm Samsung partnered with the Bank of Korea (BoK), Korea’s central bank, to conduct research on the development of a CBDC-inclined offline payment platform.
=> In a separate development, a report from Goldman Sachs suggested that digital asset adoption might be skyrocketing among family offices. The global bank surveyed up to 166 family offices across several regions, including Asia-Pacific (APAC), Europe, the Middle East and Africa (EMEA) and the Americas.
=> Ledger took center stage this week. The prominent hardware wallet manufacturer unveiled its ID-based “Ledger Recover” feature which aims to give users the opportunity to recover the seed phrase should they lose it. Ledger noted that it plans to include the feature in the 2.2.1 firmware update to its Nano X wallets.
The feature, which should ordinarily be beneficial to customers that might lose their seed phrase, received widespread condemnation and led to major concerns regarding Ledger’s security. Notably, the feature suggests that a customer’s seed phrase is accessible to Ledger, which defeats the whole idea of a hardware wallet.
Cryptos: spot, derivatives and “on chain” metrics
Very quiet week for BTC which remains between the two Vwaps shown in the chart. The Vwap anchored at the lows of the bullish impulse continues to act as support, however the Vwap marked in green has ceased to be support and has become resistance. The price action indicates that the upper value area (marked in red) is in a bearish imbalance phase, with a break and test below it. The short-term bias is short, the demand has to hold the price above the VWAP and regain higher levels to clear the idea of bearish continuations.
Bitcoin 16/05/23 10 min chart

Bitcoin 22/05/23 10 min chart

Bitcoin 16/05/23 4h chart

Bitcoin 22/05/23 4h chart

Moving up the timeframe, we are still at a key moment. Bearish imbalance or failure of the lower value area. An imbalance is desirable to always occur above the highs of the range, any deepening of the price to the lower value could seriously jeopardize any bullish approach. In this 4h timeframe there are no significant changes with respect to last week. Once again we emphasize the importance of the Vwap anchored at the lows of the last great impulse, a clear level to watch.
Ethereum 22/05/23 4h chart
No change for ETH during this past week, although we are still at a key moment as well.. The market has managed to test the vwap anchored at all time highs. We require for a bullish scenario not to lose the zone marked on the chart, buyers have to defend this zone and establish it as a buyer control zone.
We are concerned about the low volume in CEX and the low daily trading volume, which has been in a clear downtrend since March. As we have explained above we are in a phase of imbalance of the main value area. A lack of trading interest is not in favor of a bullish imbalance.
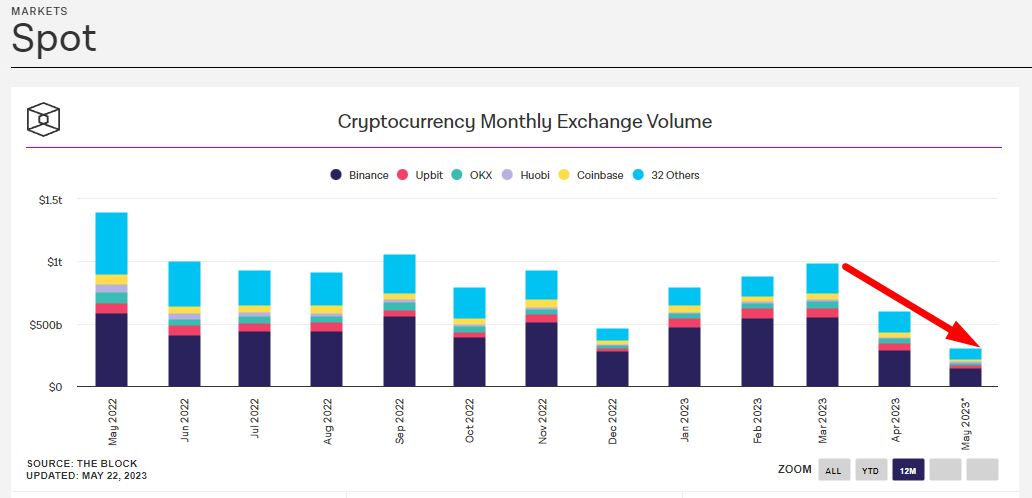

We need to see organic spot growth to validate this vigorous movement since the beginning of the year. For the moment, it seems that everything has been led by derivatives.

Continued selling pressure on futures is being observed.

Not only the crypto market but all other risk asset markets have experienced a volatility crunch. We believe that this situation of complacency is not sustainable for much longer and that at some point volatility will return and abruptly, so a strong move is to be expected sooner rather than later

Miners and Whales seems to be cashing out
The latest Bitcoin price dip followed Long-Term Holders (LTHs) capitalizing on the year's highest profit ratio, over 34%. Furthermore, on a broader scale, all market players managed to realize profits exceeding 7% on average.
This downturn is also influenced by whales taking the lead in depositing Bitcoin into exchanges, as evidenced by the early May surge in the Exchange Whale Ratio. Without a doubt, Bitcoin transactions by these whales escalated to fairly high levels, with transfers involving more than 40% of the coins.

Simultaneously, daily miner wallet outflows reached near-record highs, contributing to the selling pressure during this adjustment period. While miners' impact on price movements is lessening, understanding their actions remains essential given their considerable Bitcoin holdings. As it stands, miners possess more than 9% of Bitcoin's total supply, inclusive of Satoshi's coins
Miners' reserves are decreasing, indicating a selling pressure from the miners' side.

Classic markets
In the Opex week (options expiration) the market has managed to break out of the range in which we had been for more than a month. The strike with the highest gamma notional (4200) has acted as a magnet and the flows derived from the options market have worked their magic. We do not believe that last week is a true sign of buying strength but a movement associated with the Opex flows.

Our scenario proposed last week has been fulfilled and even the market has been able to wash out the February highs of this year. However, we left behind bad auctions and market structure, which should be corrected sooner rather than later. This week we look for retractions to the upper part of the gray value area and at that point assess the strength of demand.
16/05/23 SP500 futures big picture

22/05/23 SP500 futures big picture

As can be seen in the following chart of the gamma profile of the market, we already saw the possibility of looking for the 4200 level, as this strike acted as a magnet. We are now entering the two weeks of weakness after Opex, where the market is freer to move without being influenced by the flows derived from the expiration of options (charm and vanna).
The exposure gamma of the market is very high and options dealers are now presumed to be back in a positive gamma regime. This means, all else being equal, they should supply further vol-dampening flows into the market, as they'll need to sell futures as the market rises and buy futures as it declines in order to maintain their delta-neutral positions. If this is indeed the case, then it should put vol control funds largely on the sidelines until late next week.
We do not believe that in these conditions the market has much more upside and, moreover, we have seen during last week some serious hedging in SPX puts and VIX calls (60K June 21, 70K June 20, 91K June 27).
Gamma Profile 16/05/22

Gamma Profile 22/05/22

The degree of market concentration is bordering on surrealistic levels. Less than 40% of SPX companies are outperforming the index itself, as the YTD strength is increasingly tied to a small group of tech & mega-cap stocks. Current level ranks in the third percentile over the past decade.


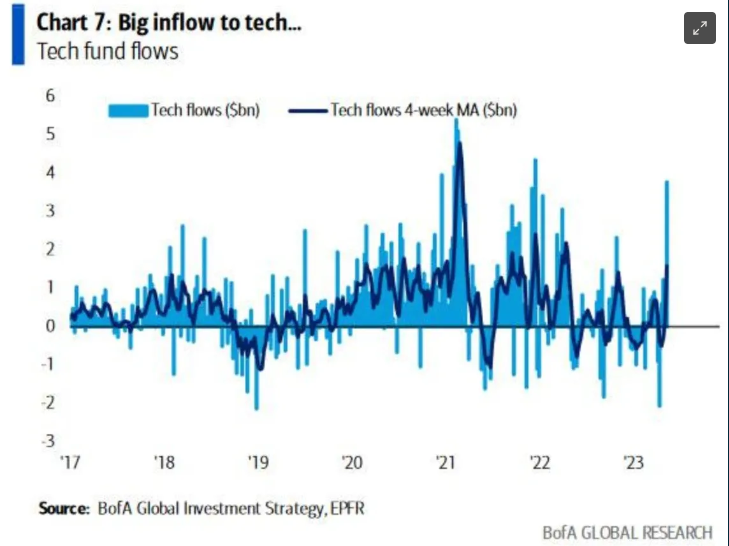
Speaking of tech, we’ve seen a surge of inflows, making the sector quite the crowded trade. Some managers are essentially looking at market capitalization as a heuristic for quality: larger is better. This has caused breadth to narrow, and often that portends to some level of increased risk when looking back at historic analogs.

The other side of the crowded tech trade is shorting US banks, which has also become quite lopsided. 80.2% of KRE’s float is short right now, for example.

The ratio between the Russell 2000 and NASDAQ 100 is back to an extreme we haven’t seen since the COVID crash. But this time it’s about the regionals tanking while tech rockets higher. Will this provoke a mean reversion trading opportunity with the extended short positioning and longs in tech?.

The market seems to have been reduced to 6 companies pulling the wheel.


Once the pantomime of the debt ceiling is overcome, the U.S. Treasury will need to scramble to replenish its dwindling cash buffer to maintain its ability to pay its obligations, through a deluge of Treasury-bill sales. Estimated at well over $1 trillion by the end of the third quarter, the supply burst would quickly drain liquidity from the banking sector, raise short-term funding rates and putting a squeeze on risky assets that already have a significant divergence from global liquidity.


