.png)


.png)
Summary
Since the start of April, the major U.S. indexes have continued to trade in a narrow range as quarterly earnings season has progressed. The S&P 500 and the Dow finished with small weekly declines while the NASDAQ eked out a tiny gain, repeating the pattern from the previous week, with the Dow underperforming again and the NASDAQ outpacing both of its peers. But overall, none of the sectors are making convincing moves in either direction, reflecting a general lack of conviction in the market.
As with the modest moves seen in the U.S. stock market recently, volatility in the government bond market has also eased relative to the big moves seen in early March. Since then, the 10-year U.S. Treasury bond yield has moved in a narrow range of as high as 3.60% to as low as 3.29%, with Friday’s yield at around 3.46%. In early March, it peaked at 4.07%.
With 92% of S&P 500 companies having reported first-quarter results as of Friday, the proportion of S&P 500 companies that have beaten analysts’ earnings expectations remained slightly higher than usual. So far, 78% of companies have exceeded net income expectations, topping the 10-year average of 73%, according to FactSet.
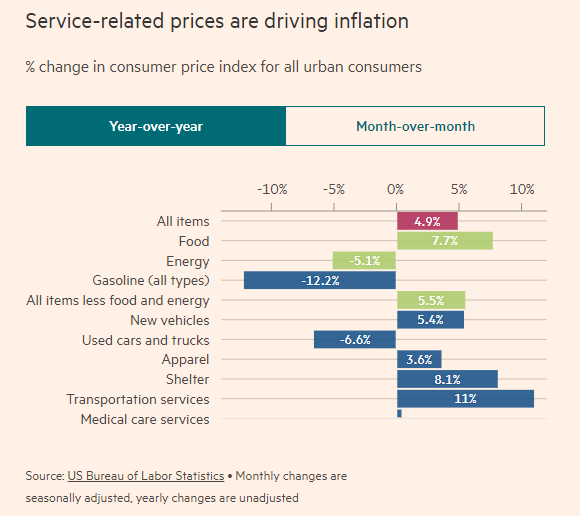
While U.S. inflation slowed for the tenth consecutive month, the latest Consumer Price Index reading didn’t register a big easing of prices, as inflation slowed to a 4.9% annual rate in April versus 5.0% in March. Excluding energy and food, prices climbed 5.5% versus 5.6% the previous month.
In focus for investors were debt ceiling talks, which were postponed to this week from Friday. President Joe Biden is expected to host top Congressional leaders on Tuesday. Markets remain prey to worries about recession, high inflation and the U.S. government inching toward what could be a catastrophic default on its debt.
We have a very soft week ahead in terms of macro data, highlighted only by US retail sales data for April on Tuesday and the Federal Reserve minutes on Wednesday. The minutes will provide more insight into the central bank's thinking on interest rates and inflation.
The price of Bitcoin, the most widely traded cryptocurrency, fell nearly 11% to its lowest level since mid-March. Bitcoin was trading at around $26,400 on Friday, down from about $30,000 a month earlier. It seems that market sentiment has definitely changed over the past few weeks, and optimism is fading. It is interesting to see if this is just a temporary correction or if a deeper winter is coming again.
Pepe, the memecoin that reigned over the market in the past few weeks seems to have finally found some sort of a top and has crashed by 60% on the weekly and by more than 70% since its all time high.
Macro and news

Inflation
US inflation was slightly weaker than forecast in April, bolstering hopes that the Federal Reserve’s interest rate increases are bringing price rises under control. Consumer price inflation dipped to an annual rate of 4.9 per cent, its lowest level since April 2021. Economists had expected it to remain steady at 5 per cent.

Core inflation, which excludes volatile food and energy prices, was in line with expectations over the period, rising 5.5%. However, “supercore” inflation, which, depending on the definition, measures services inflation less housing costs and is rumored to currently be the Federal Reserve’s preferred gauge, rose only 0.1% for the month, the lowest reading in nearly three years.

Fed officials did not seem to moderate their inflation and interest rate expectations in reaction to the data, however. In stark contrast to the three rate cuts priced into futures markets by January 2024, New York Fed President John Williams repeated on Wednesday that he did not expect a rate cut later this year. According to the CME FedWatch Tool, as of the end of the week, investors were pricing in only a 0.7% chance that the Fed would keep rates steady through the end of 2023, although this was up a bit from the 0.1% chance the week before.

US Jobs
Initial claims for state unemployment benefits increased 22,000 to a seasonally adjusted 264,000 for the week ended May 6, the highest reading since October 2021. Economists polled by Reuters had forecast 245,000 claims for the latest week. The four-week moving average of claims, considered a better measure of labor market trends as it strips out week-to-week volatility, rose 6,000 to 245,250, the highest level since November 2021.

Economists say claims in a 270,000-300,000 range would signal a deterioration in the labor market. Last week's surge could mark the start of an upward trend as the cumulative and lagged effects of the Fed's rate hikes broaden out in the economy. Layoffs, which were initially concentrated in the technology and housing sectors, appear to be spreading to other industries as companies gear for weak demand.

Eurozone Macro Data
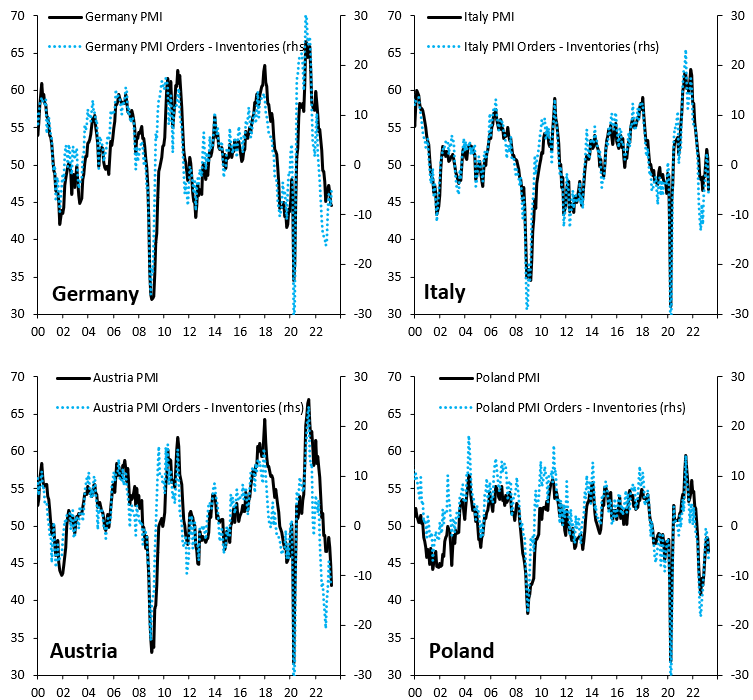
European data is starting to look really bad. Headline PMI indices (black) are falling sharply across the Euro zone and Poland and are everywhere below the critical 50 threshold.


The drop of -4.1% in eurozone production in March likely overstates the weakness at the end of the first quarter, due to a curious decline in Ireland. But, most major economies did post significant declines in production, signaling broad weakness for industry in March. The decline in March (following a 1.5% rise in February) brings industrial production back to the lowest reading since October 2021.
Eurozone Industrial Production (mom) (mar) actual: -4.1% vs 1.5% previous
Eurozone Industrial Production (yoy) (mar) actual: -1.4% vs 2.0% previous

Banking Crisis

There are two peculiarities about this banking crisis. Firstly, it wasn’t a systemic event, with the bulk of the tension in the US regional, mid-sized banking sector. And secondly, it wasn’t caused by bad debt or obscure products that lost value, like in 2008. Instead, the crisis was driven by unique factors including large amounts of uninsured deposits and losses on banks’ investments in government bonds relative to the size of their capital base.
The most important question now is what will happen next and how this mini crisis in the banking sector will play out. The good news is that unlike in 2008, this crisis appears to be easier to solve. The Fed has room to cut interest rates if the banks continue to struggle and if this impacts the real economy. However, at this stage, the real economy is proving resilient.
Since the start of March, the US regional and mid-sized banking index has lost more than 30% of its value, and it’s not yet in recovery mode. Banks might not recover until there’s an overhaul of regulation for the sector and/or the end of the Fed’s interest rate hiking cycle.
Interest rates are at the core of where US banks go next. If we get even higher rates, we could enter a more toxic phase of this crisis. Not only would it be an issue of deposit flight, but it could be driven by a fear of the underlying value of loans on the banks’ books.
Small and medium-sized banks in the US issue nearly 70% of all commercial real estate debt, which is sensitive to rising interest rates. If interest rates continue to move higher without a break, the commercial property market could be at risk from rising bad loan rates. Combined with losses on their treasury portfolios, this could leave banks in dangerous territory as we move through 2023.
Demand for Commercial Real Estate (CRE) Loans has dropped to an all-time low!

Last week, PacWest and Western shares rebounded 82 percent and 49 percent, but shares in both banks, as well as in Texas' Comerica and Utah's Zions Bancorp, resumed their tumble this week. Federal Reserve chair Jerome Powell tried to reassure markets by declaring the U.S. banking system is "sound and resilient." But it sounded "akin to a sports team owner giving the coach a vote of confidence", never a good sign.
US bank deposits declined further going into April month-end.

Credit tightening on its way
The Fed's Senior Loan Officer Opinion Survey was released last monday after the market's close. It showed that banks continued to tighten their lending standards following the banking crisis that started during the second week of March. The Fed survey of bankers showed 46% tightened lending standards in Q1 2023. That's heavily in recession territory and nearing the contractionary levels experienced during Pandemic, GFC, Dotcom Bust, and Gulf War Recession.

Banks expect to tighten credit standards for all types of loans during the rest of 2023, the Federal Reserve said last Monday, noting that stresses in the banking system beginning in March prompted lenders to sharpen credit terms during the first quarter. Demand for loans fell during the period.

The share of banks increasing spreads on business loans hit the highest levels since the GFC.

The US consumer faces very tight credit conditions.


Credit crunch in an indebted world
Total US household debt rises by $148 billion in the first quarter of 2023, to a total of $17.05 trillion. This is the first time in history that total US household debt has crossed $17 trillion.
Breakdown of the large categories:
1. Mortgage Debt: +$121 billion to $12.04 trillion
2. Auto Loans: +$10 billion to $1.56 trillion
3. Student Loans: +$9 billion to $1.60 trillion
4. Credit Card Debt: Unchanged at $986 billion
Debt levels continue to hit new records every quarter despite the fastest rising interest rates in history. Consumers ran out of money and are using debt to "fight" inflation.


Delinquency rates are beginning to rise again, now at 2.6% nationally. However, the sharp drop in student loan delinquency came as student loan payments were halted. This summer, payments will resume for the first time since the pandemic.

Debt ceiling
Over the next couple of weeks, we will either witness two sides of politics reluctantly sign off on an agreement to boost the current US$31.4 trillion debt ceiling or we will all experience an unprecedented and totally avoidable financial Armageddon.
President Joe Biden is expected to meet Tuesday with congressional leaders on the debt ceiling limit following “productive” staff-level negotiations over the weekend, as the US barrels toward a deadline that could come as soon as June 1.
Negotiators have been able to pinpoint some areas on which congressional staff and the White House can find common ground, including revising the permitting process, rescinding unspent Covid-19 relief funds and potentially cutting spending.
Biden said Sunday that he was waiting to hear Republicans’ exact proposals on work requirements for certain government aid programs. He said he has voted in the past for “tougher aid programs” that are now law but “for Medicaid, it’s a different story.” Negotiators recognize they will likely need to have an outline of a deal by the end of the week to ensure a bill can pass through Congress by June 1, the sources said, but they also think there are potential congressional tools that can be used to speed up the process if needed.
The more Debt they have the higher the Ceiling goes:
US national debt
1st of January, 2000: $5.7 trillion
1st of January, 2010: $12.3 trillion
1st of January, 2020: $23.2 trillion
Now: $31.4 trillion


US 5yr CDS going back to ‘08

Crypto News
FTX founder, Sam Bankman-Fried, petitions a Manhattan federal court to dismiss most of the criminal charges against him related to the exchange’s collapse. Ex-Coinbase manager, Ishan Wahi, is sentenced to two years in prison, marking the first insider trading case in the crypto sector.
Seattle-based crypto exchange Bittrex files for Chapter 11 bankruptcy amid ongoing legal challenges by the Securities and Exchange Commission (SEC).
Jane Street Group and Jump Crypto, two of the world’s top market-making firms, are pulling back from trading digital assets in the US as regulators crack down on the industry. Jane Street is going even further by scaling back its crypto ambitions globally because regulatory uncertainty has made it difficult for the firm to operate the business in a way that meets internal standards.
Regulatory crackdowns have focused on multiple fronts, including trading platforms, stablecoin issuers and brokers. In one example, Coinbase Global Inc., the largest US crypto exchange, received a warning earlier this year from the Securities and Exchange Commission about a potential enforcement action.
Jane Street and Jump Trading were caught up in some of the turmoil, and were among trading firms questioned by US prosecutors in a probe of the failed TerraUSD stablecoin project. Jump Crypto had been a major backer of the TerraUSD project since 2019. Jane Street was also among the three US quant-trading firms cited anonymously by the Commodity Futures Trading Commission in its lawsuit against Binance Holdings Ltd. as examples of how US-headquartered clients were able to access the platform despite Binance’s promises to exclude them. The regulator also didn’t accuse the trading firms of wrongdoing.
The apparent exit or reduction in trading by Jane Street and Jump Crypto, two influential cryptocurrency market makers, has the potential to disrupt the fragile flow of liquidity across the industry. Liquidity has still not recovered from Alameda's collapse, and a slowdown with two of the biggest surviving market makers could weigh on liquidity even further. We might see it in the future if brokers, payment providers and other actors looking to source liquidity start shifting offshore or to Europe and Asia.
Market depth, a metric used to measure liquidity on exchanges by assessing how much capital is required to move a market, slumped by more than 50% following the collapse of FTX and has failed to recover despite a rise in crypto prices.

Digital Currency Group (DCG) seeks to refinance its obligations to Genesis Capital, its insolvent lending arm, as part of a broader strategy to raise growth capital.
Grayscale Investments announces plans to launch three new exchange traded funds (ETFs) and create a new entity, the Grayscale Funds Trust.
Bitcoin’s network congestion leads to a temporary halt of withdrawals on Binance and calls for a reconsideration of BRC-20 transactions. According to data from Bitinfocharts, the average transaction fee on Bitcoin reached $62 on May 7, 2023, the highest level since April 2021. The median transaction fee also spiked to $26, indicating that users had to pay more to get their transactions confirmed faster.
The cause of this increase in fees and congestion was the growing popularity of BRC-20 tokens, which are an experimental token standard for creating and issuing tokens and NFTs on Bitcoin. BRC-20 tokens are powered by Ordinals, which is a layer-2 protocol that allows users to create and trade inscriptions, which are small pieces of data embedded in Bitcoin transactions. BRC-20 tokens are inspired by Ethereum’s ERC-20 token standard, which has enabled a flourishing ecosystem of decentralized applications (dApps) and decentralized finance (DeFi)
However, BRC-20 tokens also have some drawbacks and limitations. One of them is that they consume a lot of block space on the Bitcoin blockchain, as each token transaction requires an inscription. This means that more users are competing for the limited space available in each block, which can only accommodate around 2,000 transactions on average. As a result, users have to pay higher fees to incentivize miners to include their transactions in the next block. One of the main challenges facing Bitcoin is a fundamental dilemma: it cannot be both a digital gold and a smart contract platform.
Network transaction fees have normalized. Yet, BRC-20, despite its intent, appears flawed, failing to foster meaningful evolution within the system.

Cryptos: spot, derivatives and “on chain” metrics
Relevant movements during the past week. The market has been testing the relevant vwap (white) anchored at the last impulse lows. If buyers want to regain control it is essential that they recover the vwap (green) that has served as support for several weeks and in turn conquer the vwap anchored at the local highs of this chart. The risk of a bearish imbalance of the upper structure is on the table.
Bitcoin 08/05/23 10 min chart

Bitcoin 16/05/23 10 min chart

Bitcoin 08/05/23 4h chart

Bitcoin 16/05/23 4h chart

We have reached the target proposed last week, the vwap anchored at the lows of the last impulse. Key moment we are facing now, effective bullish imbalance or failure of the lower value area. Demand must take control again to prevent the price from falling back into the main lower value area and cancel the bullish setup.
Ethereum 16/05/23 4h chart

Interesting moment also for Ethereum. The market has managed to test the vwap anchored at all time highs. We require for a bullish scenario not to lose the zone marked on the chart, buyers have to defend this zone and establish it as a buyer control zone.
Coordinated FAKE NEWS about the US government selling Bitcoins leads to second-largest long liquidations in 2023.Many accounts retweeted this news without any fact-checking, and as a result, we saw the second-largest long liquidations in 2023, with over $36M being liquidated within one hour.

BTC began to rise early this year, rising from its lowest price by up to 100%. Looking at various on-chain cycle indicators, Bitcoin appears to have entered a recovery period from a downturn, showing further upside potential after the adjustment. Nevertheless, there are several reasons why the rise will be limited.
First, the decline in US BTC holdings. In the past, when US institutional investors' BTC holdings increased during major bull markets, the price rose significantly. However, US institutional investors' BTC holdings have been declining continuously in recent months. This is likely due to the fact that they have switched to global exchanges and DEXs rather than US exchanges due to the ongoing regulation of the crypto market by the SEC.

Digital asset investment products saw a 4th consecutive week of outflows totaling $54m, bringing the total outflow to $200m, representing 0.6% of total assets under management.

Second, the total supply of stablecoins has decreased. The total supply of stablecoins shows how much buying capacity is in the crypto market. In February 2022, it peaked at $99 billion and is now at $71.1 billion, indicating that buying power in the crypto market has fallen.

Third, the absence of new smart money players. If you look at the BTC Token Transfer indicator, there is no change. This seems to have been largely caused by supply and demand factors, not by the rise of smart money. When Bitcoin fell to 15.8K due to the FTX crisis, the proportion of long-term holders was already close to 80%. Also, liquidity expansion caused by the Fed's expansion of its balance sheet in March created an explosive price increase.

Fourth, the market is completely dominated by derivatives; we believe that organic growth from spot is absolutely necessary. Cryptocurrency derivatives trading volume on centralized exchanges fell in April, but spot trading volume declined even more, pushing the derivatives market share up to a new all-time high.
According to CCData, the market share of crypto derivatives trading rose to a record 77.6% even as absolute derivatives trading volume slid 23.3% to $2.15 trillion. Pushing the market share higher was a 40.2% tumble in spot volume to $621 billion.

Uniswap, the decentralized exchange, outpaced centralized exchange Coinbase in April. Uniswap handled some $37 billion trading in April, compared to March, when it handled over $70 billion. Coinbase saw $34 billion worth of trading volume on its exchange in April, versus $49 billion in March.

Classic markets
We want to start by emphasizing that market conditions and the associated flows have changed radically in recent years. We have to be aware of what we are facing and our position in the market.
While human portfolio managers fret over economic uncertainty and the health of the US banking system, some algorithmically driven hedge funds have been buying stocks at one of the fastest rates in a decade, according to bank trading desks. Quant funds have been piling into US stock markets in response to falling volatility, helping to prop up the market as active managers sit on the sidelines.
It seems that systematic reallocation has actually been the [main] source of demand apart from buybacks. The trend among quant funds helps to explain why the US stock market has proven surprisingly resilient this year despite the widespread pessimism, with the S&P 500 gaining 8 per cent year to date.
These funds move fast and unemotionally and they are not parsing through earnings or taking a view on the stickiness of inflation, this is about price trends and momentum. There are several types of systematic strategies, including “volatility control” funds, commodity trading adviser funds, and “risk parity” funds. Their approaches vary, but all three rely on realized and expected market volatility as critical drivers of where they allocate assets.
Nomura estimates that vol control funds alone have added about $72bn in US stocks in the past three months. That was a greater flow than in 80 per cent of three-month periods over the past decade. In contrast, stock market exposure among active managers is close to a one-year low, according to Deutsche.
Wild swings in markets throughout 2022 encouraged systematic funds to reduce their exposure or even bet on further declines, exacerbating the downturn. The S&P fell 19 per cent last year. However, volatility has fallen dramatically since the fourth quarter as fears about US interest rate rises and the health of the global economy have eased. This volatility crunch automatically prompts many quant funds to ramp up their stock investments.
The goal of these strategies is to maintain a consistent level of volatility within a portfolio, irrespective of market conditions. This is achieved through the use of volatility scaling, which adjusts the size of positions in a portfolio based on changes in realized volatility. The mechanical nature of these strategies means that they do not consider factors such as price or macroeconomic conditions, instead focusing solely on maintaining a specific level of risk.
Investors briefly began increasing their allocation to US stocks after a strong start to the year in January, but have been put off again since the collapse of Silicon Valley Bank in March triggered broader worries about the US banking sector. Low exposure to stocks has contributed to poor performance among many investors. Two-thirds of actively managed mutual funds failed to beat their benchmark in the first quarter as portfolio managers were caught off guard by the rally, according to Bank of America.
Quant funds are relatively small compared to the overall market. CTAs had total assets under management of about $365bn at the end of 2022, according to BarclayHedge, less than 10% of the $4.8tn hedge fund industry. However, because multiple funds tend to follow trends in tandem, their flows can affect the broader market, particularly when other investors are avoiding making any bets.
According to Goldman Sachs, CTAs could become net sellers of up to $276B of SP500 futures exposure on any downdraft. This is a ticking time bomb in an environment of high macro and geopolitical uncertainty.

April had the narrowest trading range since 2017. Clearly the market is stuck between 4150-4200 and 4100-4050 points on the SPX. This week without important macro data comes with numerous speeches from Fed members (including Powell on Friday) and OPEX (monthly options expiration). The flows derived from the options market, with expiration so close, should theoretically avoid major market movements this week, so it is extremely difficult for us to consider scenarios even in the short term.

08/05/23 SP500 futures big picture

16/05/23 SP500 futures big picture

Taking into account the compression and overlapping of the market going back to the beginning of April and that this week is OPEX, we have a slight long bias as long as the market manages to hold the 4100 putwall and the anchored vwap shown in the chart which has clearly acted as support. A reasonable target would be to look for slight upward movements in the direction of the previous high.
Gamma Profile 08/05/22

Gamma Profile 16/05/22

The strike with the highest gamma notional is 4200, and if it continues to do so during the week it will act as a magnet for options expiration. The low GEX (gamma exposure) supports such a scenario, the market is not overloaded.
Looking ahead, we anticipate the arrival of a new phase in the liquidity saga, which could have a double negative impact. Once the debt ceiling issue is resolved, Janet Yellen will regain the legal authority to replenish the depleted TGA. However, this process inherently hampers liquidity, as spending down the TGA injects liquidity into the economy while building its backup withdraws liquidity from the economy. Simultaneously, the Federal Reserve will persist in extracting liquidity from the system through quantitative tightening while banking deposits continue to shift towards money market funds that offer higher yields.

We continue to see extreme readings in terms of market concentration. It seems that technology is just the market and it seems to be a bit saturated as a “safe heaven” asset.
Microsoft and Apple now account for a record 13.4% of the S&P 500. This is the most *ever* for the top two stocks.

Apple is now worth more than the entire Russell 2000 index combined!


