.png)


.png)
Summary
Debt ceiling soap opera is finally over. The House of Representatives passed the bill by a surprisingly large margin on Wednesday, but this also seemed to have limited impact on markets. After the Senate’s passage of the measure late Thursday, the bill headed to President Joe Biden on Friday for his signature into law.
Investors appeared to return their attention to economic data. On Wednesday, stocks pulled back following news that job openings rebounded much more than expected in April and hit their highest level (10.1 million) since January. March’s data were also revised higher. The probability of a mid-June Federal Reserve (Fed) interest rate hike priced into futures markets jumped to 71% on the news, compared with only 23% a month earlier.
US recession worries aren’t dead. But they may have passed into a coma on Friday. That’s when the Labor Department released its latest jobs report, which indicated employers are hiring virtually all the workers they can find 339,000 in May alone.The report brought a sigh of relief from many economists. There have been a number of recession alarm bells ringing in recent weeks.
The major benchmarks ended with solid gains for the week, with the S&P 500 Index touching its highest intraday level since mid-August 2022. The technology-heavy Nasdaq Composite Index notched its sixth consecutive weekly gain and hit its best level since mid-April 2022. Recessions aren’t just about jobs. But the strength of the labor market, and what it means for consumer spending, is central to whether the US economy is growing or shrinking. Consumer spending is responsible for more than 75% of US economic activity. If U.S. consumers have jobs and paychecks coming in, they’re likely to keep the economic engine purring along.
As we look past the U.S. debt ceiling, the next market catalyst on the horizon perhaps lies in the June 14 Federal Reserve meeting. In recent weeks, several Fed officials have indicated that the Fed's focus remains squarely on fighting inflation, which remains too elevated for comfort. Despite better trends in headline inflation, PCE (personal consumption expenditures price index) inflation data last week moved higher, and services inflation remains persistent, driven by a solid labor market and still-elevated wage growth.
We will get critical economic data ahead of the June 14 meeting, including a U.S. nonfarm jobs report and CPI inflation data for the month of May, both of which are expected to show some cooling and could help determine the next move in interest rates.
Investors had flocked to Bitcoin and other cryptos in March and April as the U.S. banking crisis drove contagion fears. But worries about the stability of the U.S. banking system evaporated as quickly as they arrived, rapidly ending the rally. Cryptoworld remains laser focused on regulatory battles all over the world, as regulators craft new rules to govern how crypto trading should be managed. The biggest potential catalyst for crypto prices in June is a familiar one, Fed monetary policy. The Fed has been aggressively raising interest rates since March 2022 in an effort to bring down inflation, and rising rates have weighed on the prices of cryptocurrencies and other risk assets.
Low volume and conviction, limited catalysts and outperformance (year-to-date) leave the digital asset sector stuck in a trading range with a challenging macro backdrop likely capping digital assets upside.
Crypto prices stabilized in the closing weeks of the month as volatility significantly died down. Bitcoin was on track to finish the month above $27,040. After dropping as low as $1,740 in May, Ethereum (ETH) prices also stabilized, putting them on track to finish out the month above $1,860.
Macro and news

We remind readers that Fed blackout period begins, no speakers and the next Fed meeting in 10 days.
U.S Macro data
339,000 new payrolls were added in May, nearly double consensus expectations (190,000) and up from the prior month. This was the best month of hiring since January's 472,000 gain and a slight reacceleration over the last several months, even in the face of a slowing economic backdrop. The Labor Department reported that the number of people losing jobs or completing temporary jobs jumped significantly in May and reached its highest level since February 2022. We think the extreme tightness in employment conditions is set to loosen over the remainder of this year.

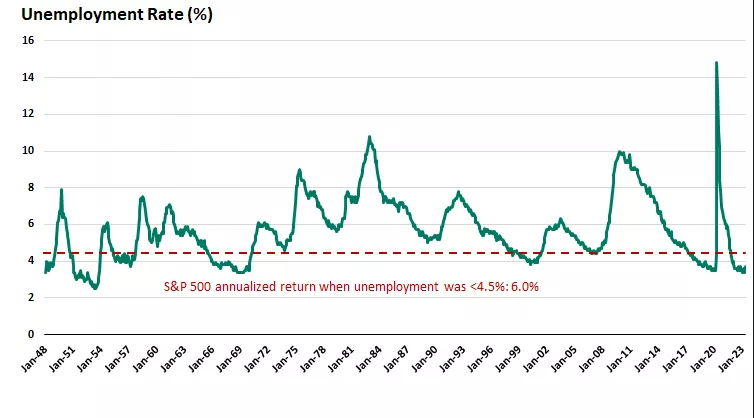
The unemployment rate rose to 3.7%, the 16th consecutive month below 4%. This is the longest such streak since the 27-month stretch between 1967 and 1970, and the fourth-longest period below 4% in the post-war era. The strong monthly payroll gain appears at odds with the rise in the unemployment rate, a mixed trend that we view as confirmation that the labor market is at an inflection point, undergoing a transition from a two-year sprint toward a brisk walk as we advance.
Job openings rebounded much more than expected in April and hit their highest level (10.1 million) since January. March’s data were also revised higher. The probability of a mid-June Federal Reserve interest rate hike priced into futures markets jumped to 71% on the news, compared with only 23% a month earlier.

Other gauges of employment conditions are signaling moderation ahead. Job openings, while still three million above pre-pandemic openings, have declined by nearly two million over the past year, including a decline of one million just in the last four months. Job postings are on a gradual downtrend as well, with employers tightening their belts in anticipation of slower demand.
Slower wage growth will be a key driver of further declines in inflation over the remainder of the year. This in turn adds support to an approaching conclusion to the Fed's rate-hiking campaign. The decline in the pace of wage growth last month lends support to the case for the Fed to move to the sidelines and pause on rate hikes, although admittedly the continued strength of monthly payroll increases complicates the picture somewhat.

The Institute for Supply Management (ISM) said on Thursday that its manufacturing PMI fell to 46.9 last month from 47.1 in April. It was the seventh straight month that the PMI stayed below the 50 threshold, which indicates contraction in manufacturing, the longest such stretch since the Great Recession.


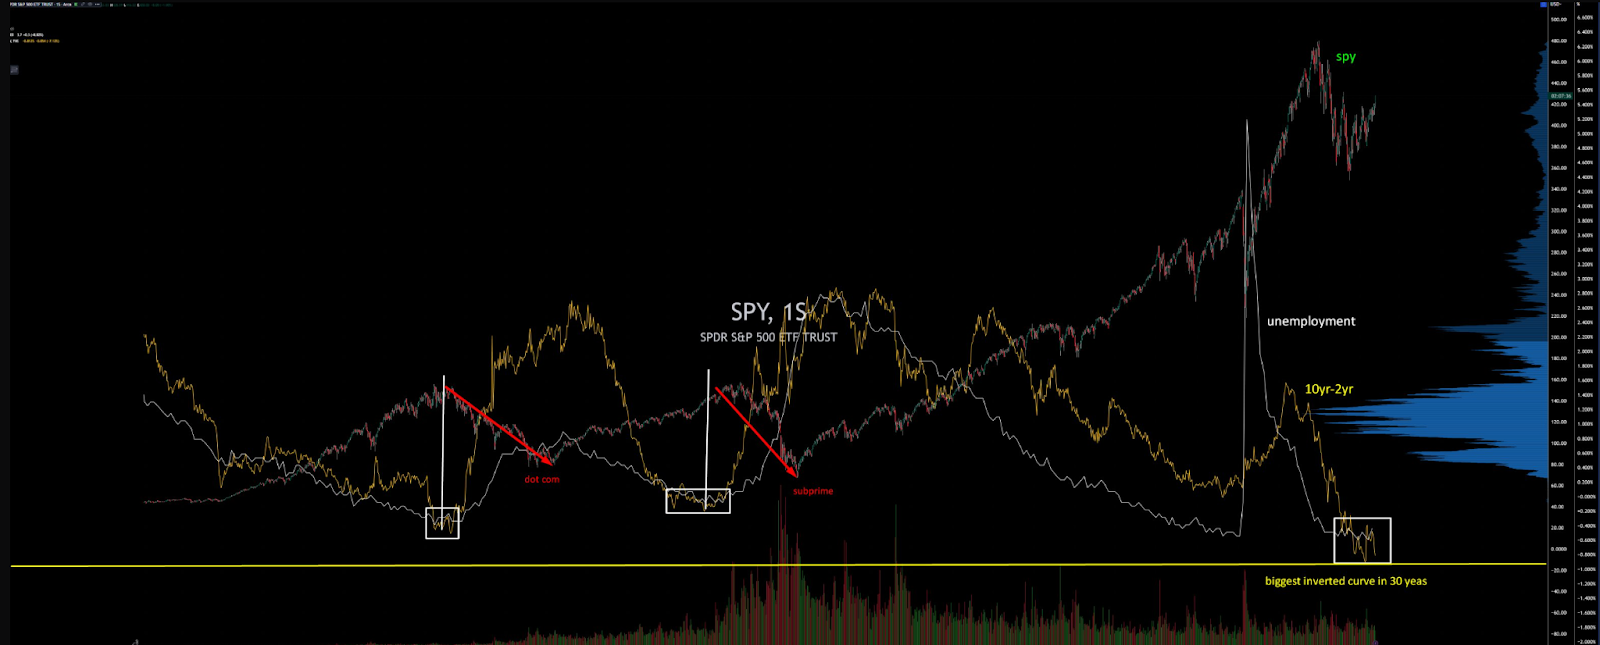
With the worst inversion in 30 years and unemployment as always lagged behind. It would be the first time in history that a bull market was born before entering a recession. The effect of monetary policies takes time to materialize, yet the market and its participants live in a state of hypnosis and fomo that seems to make them forget these issues.
Eurozone macro data
Eurozone inflation slows but Ecb policymakers warn on rates
Headline inflation in the eurozone slowed to an annual 6.1% in May from 7.0% in April, below a FactSet consensus estimate of 6.3%. The core rate, which excludes volatile food and fuel prices, came in at 5.3%, which was also an improvement from the prior month and below expectations.

European Central Bank (ECB) President Christine Lagarde reiterated in a speech that inflation was still too high and “it is set to remain so for too long." She added: "That is why we have hiked rates at our fastest pace ever, and we have made clear that we still have ground to cover to bring interest rates to sufficiently restrictive levels." The minutes of the ECB’s May meeting showed most policymakers voted to slow the pace of rate increases to a quarter point but signaled an appetite to tighten monetary policy further.
Eurozone confidence falls to six-month low. Eurozone Economic Sentiment Indicator fell from 99.0 to 96.5 in May (its lowest level since November 2022). The Employment expectation Indicator dropped from 107.5 to 104.7. Sentiment deteriorated among manufacturers, service providers, retailers, and constructors. However, consumers were slightly less pessimistic, as households became more positive about their financial situation.

UK macro data
British shop price inflation picked up this month to reach its highest rate since industry records began in 2005, although growth in food prices cooled slightly, a survey showed on Tuesday. The British Retail Consortium said prices in supermarkets and retail chains rose 9.0% in the year to May, after an 8.8% increase in April. Food price inflation as measured by the BRC slowed, however, to 15.4% from 15.7%.

The UK's inflation problem is bigger than expected, leaving the Bank of England no other option but to further hike rates. Markets expect four more rate hikes taking the Target Rate to over 5.50%. Remember, UK pension and insurance companies nearly collapsed back in September when the unfunded tax reduction proposals sent short-term rates spiraling higher.
China macro data
China’s official manufacturing Purchasing Managers’ Index (PMI) fell to a below-forecast 48.8 in May from April’s 49.2, marking the second consecutive month of contraction and the lowest reading since December 2022. Production activity fell into contraction for the first time since January, dragged down by declines in new orders and exports. The nonmanufacturing PMI also eased, falling to a weaker-than-expected 54.5 in May from 56.4 in April.
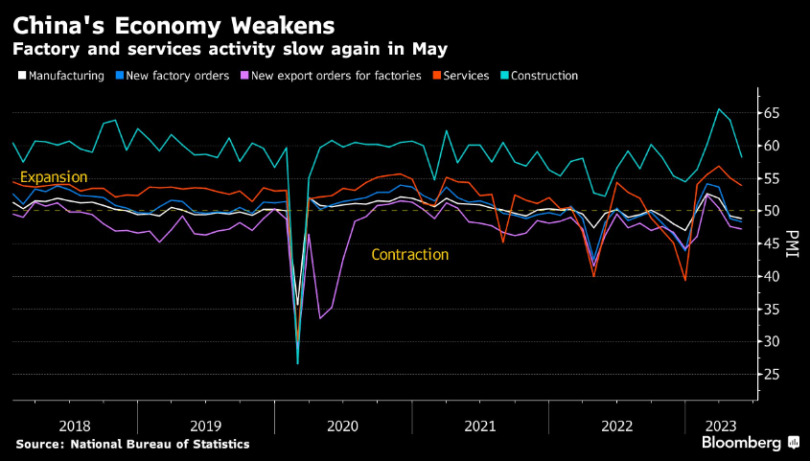
Major Chinese industrial firms’ profits plunged 20.6% year on year between January and April. Manufacturing activity also contracted for the first time in three months, according to the Caixin China general manufacturing purchasing managers’ index.
China’s much-vaunted economic rebound after its emergence from strict zero-Covid lockdown measures has yet to fully materialize, prompting some economists to speculate that further fiscal stimulus or monetary policy easing could be coming down the pipeline.
Crypto News
=>The ongoing regulatory crypto crackdown and legal battles with Ripple and Coinbase will continue to dominate the headlines in June. Coinbase, Ripple and other crypto companies have reportedly been exploring shifting their businesses outside of the U.S. to avoid the regulatory crackdown. Meanwhile, regulators say more protections must be put in place to protect investors from the types of failures that led to the collapse of several crypto lenders and exchanges in 2022. Institutional investments will likely continue to be constrained until regulatory clarity is made through these cases.
=>The European Union formally signed its landmark Markets in Crypto Assets (MiCA) regulation into law last Wednesday, taking the bloc closer to becoming the first major jurisdiction in the world with tailored rules for the sector. The law was signed by the European Parliament President Roberta Metsola and Swedish Rural Affairs Minister Peter Kullgren, alongside a separate anti-money laundering law that requires crypto providers to verify their customers' identity when they transfer funds. Attention has also turned to the next stage of EU crypto regulation, with future laws potentially covering topics such as staking, non-fungible tokens and decentralized finance.
Fabio Panetta, a member of the Executive Committee of the European Central Bank (ECB), recently announced that the European Commission would be presenting a legislative proposal for the digital euro in June. He further stated that the next steps would be decided in October. According to Panetta, the test phase of the European CBDC could last two to three years with the launch of the digital euro in three to four years.
=>TP ICAP, the world’s largest interdealer-broker, announced last week that its Fusion Digital Assets marketplace for spot crypto trading had gone live with its first trade. Traditional finance-tailored companies need to have strict governance and regulatory structures in place before offering any service to investors, which makes the launch of a new marketplace a long and difficult process. TP ICAP aims to offer infrastructure that looks more familiar to institutional investors than what’s offered by vertically-integrated crypto exchanges that combine their exchange, custody and other businesses and create potential conflicts of interest.
=>New rules for ‘Virtual Asset Trading Platform Operators’, aka crypto exchanges, kick in on June 1, 2023 in Hong Kong. The guidelines will allow licensed exchanges to sell highly liquid cryptocurrencies to retail investors. With Hong Kong’s Securities and Futures Commision (SFC) laying out the rules that define what cryptocurrency exchanges need to do to be licensed in the city and operate legally, could this be a sign of China softening its position on digital currencies.
=>Atomic Wallet has reportedly been exploited, with users reporting complete losses of their crypto portfolios. The developers of Atomic Wallet are investigating reports of large-scale theft of cryptocurrency from users' wallets, with over $35 million in crypto reportedly stolen Atomic is a noncustodial decentralized wallet, meaning users are responsible for assets stored in the application.
=>Lawsuit against Elon Musk over doge manipulation gathers steam. Last Wednesday, the Manhattan federal court in New York received a third added complaint in a proposed class action first filed on June 16, 2022. The complaint accuses Elon Musk of insider trading, compiling a wide range of activities under one legal umbrella to bolster the case
=>The team behind Trust Reserve, which issues two stablecoins, was detained by police in China on May 29, according to PANews. Though the reason for the arrest of Trust Reserve’s team is unclear, authorities could be clamping down on digital payments not using its RMB central bank digital currency.
The stablecoin issuer had raised $10 million in a Series A+ funding round led by KuCoin Ventures, with participation from Circle and IDG Capital. The company had announced back then it had around 60 employees with plans to hire more. This comes alongside rumors that the Multichain core team may have been detained in China. The protocol still has partial downtime and there have been no updates from the core team in China for over a week.
=>As Binance Australia is facing a cut off from a key local on-ramp service, traders have been trading Bitcoin (BTC) and other cryptocurrencies at a discount on the platform. On May 30, Bitcoin traded at about A$34,863 ($22,589) on Binance Australia. This was about A$7,516 lower than the average price on platforms such as Independent Reserve and CoinJar, according to CryptoCompare data. Discounts of some 20% were also visible for coins such as Ether and Solana, Bloomberg reported. From June 1, Binance Australia’s users will no longer be able to withdraw Australian dollars to their bank accounts with the use of the country’s popular PayID service. Earlier this month, the platform was deprived of access to some AUD deposit services.
Cryptos: spot, derivatives and “on chain” metrics
The benchmark cryptocurrency is coming off its first down month of the year, shoved to the side by investors who were more focused on new developments in artificial intelligence and yet another interest rate hike from the Fed in May and the possibility of one more in June or July. The crypto market leader finished May down 7.9%, according to Coin Metrics, while ether posted a 2% loss. Absent other clear catalysts, such as the U.S. regional bank crisis whose start and end coincided with the crypto rally. Price movements in June will probably be determined yet again by inflation, monetary policy and regulatory updates.
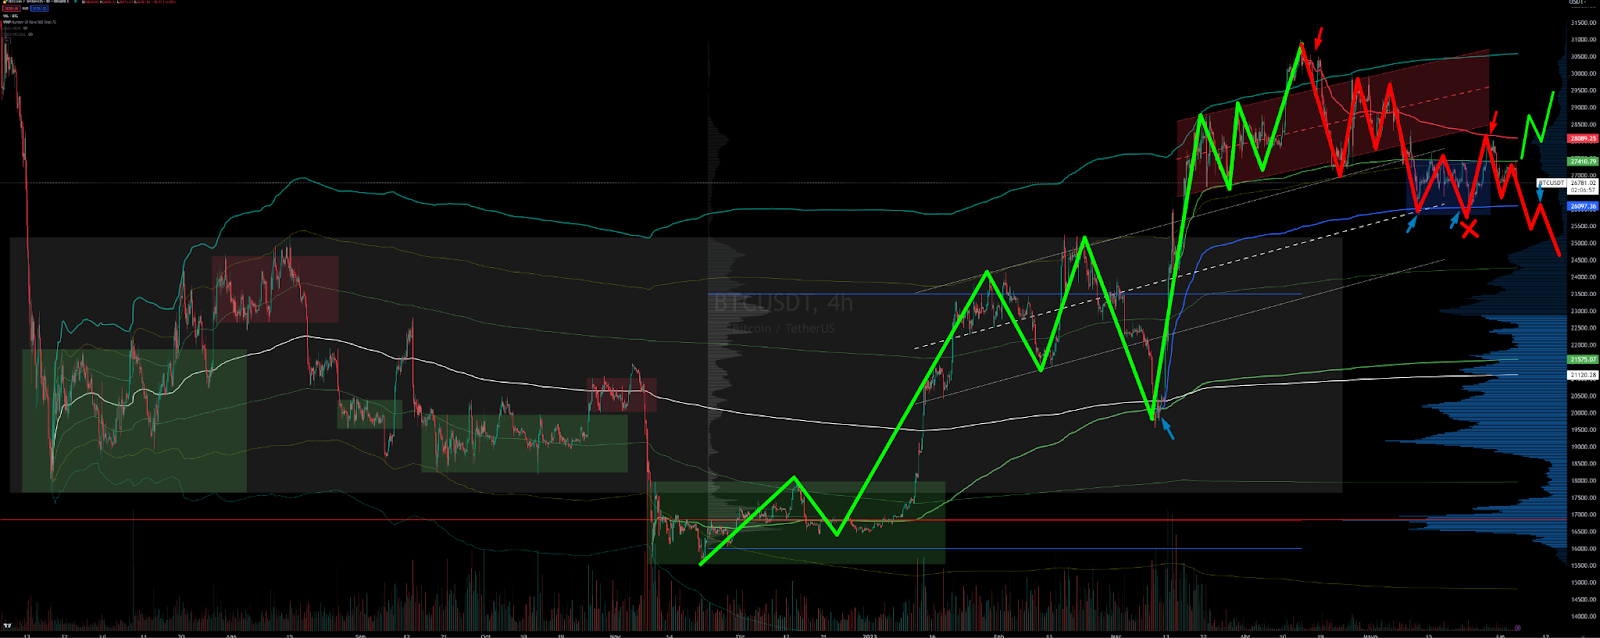
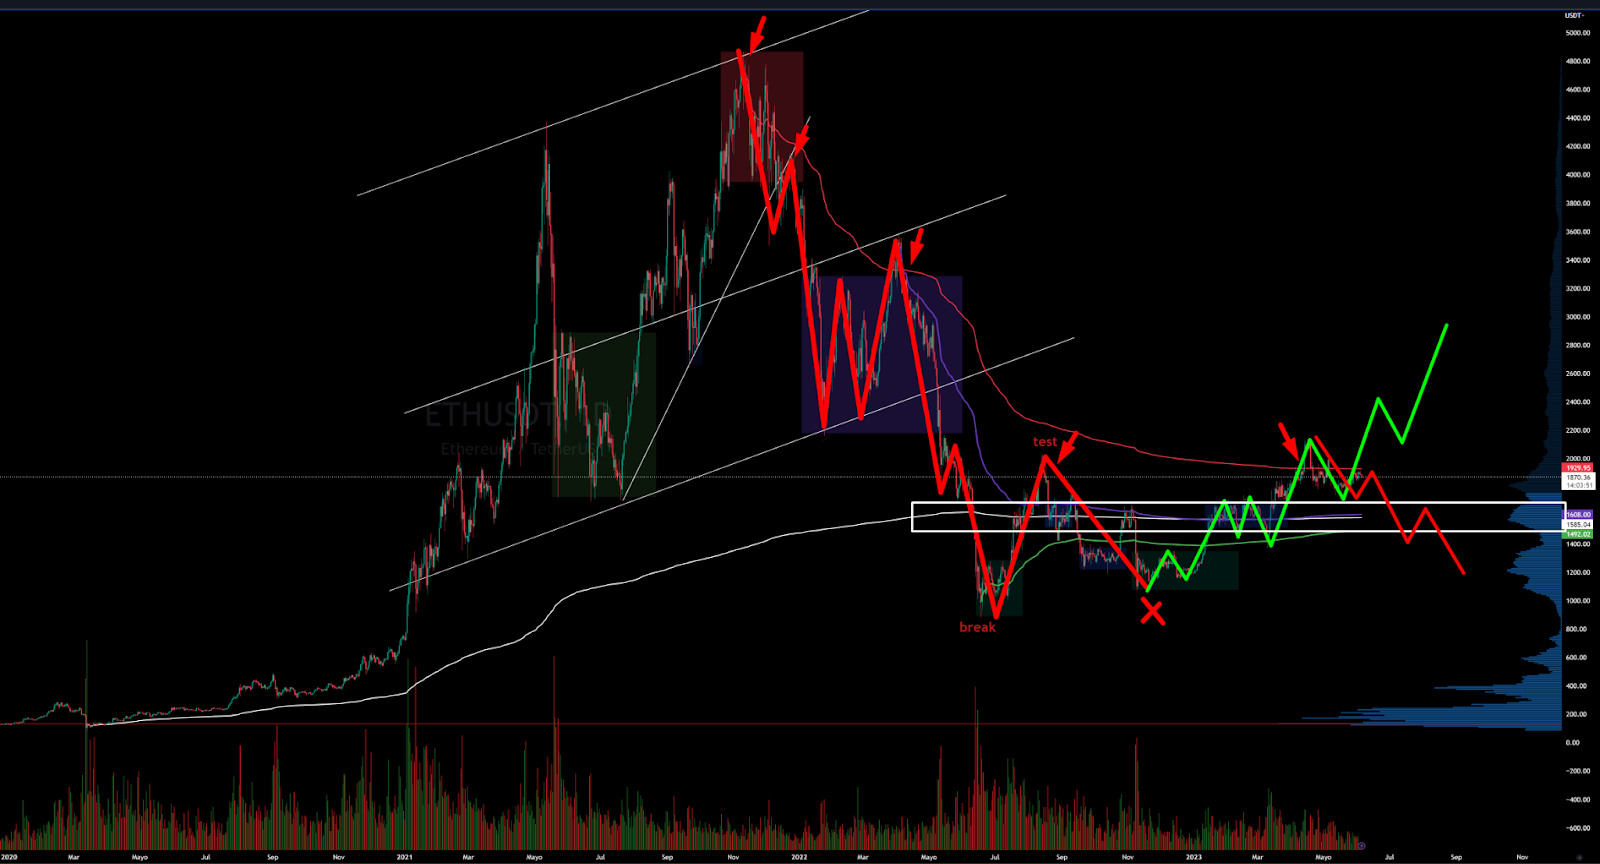
From the technical aspect it is time to emphasize the price dynamics around the different value areas. The upper value area marked in red has left us with a failed bearish imbalance with rotation to a cumulative structure (marked in blue). However, this cumulative structure has failed in bullish continuation opening the door to a bearish break and test on two legs of the red upper value area. As always key, the Vwap anchored at the lows of the impulse that is clearly acting as support.
Our bias is neutral-bearish due to the aforementioned dynamics and we will rotate to full bearish in the short term with the loss of the aforementioned Vwap. The ball is in the bulls' court, if they want to turn this situation around they must conquer in a vigorous way and showing real strength the Vwap anchored at the local highs and the high volume node $28100.
Bitcoin 29/05/23 10 min chart

Bitcoin 05/06/23 10 min chart

Bitcoin 29/05/23 4h chart

Bitcoin 05/06/23 4h chart
Moving up the timeframe is where we observe that a break and test in two legs of the upper red value area can actually materialize and this would have major implications on the lower core value area. We are still at a key moment. Bullish imbalance or failure of the main lower value area. An imbalance is desirable to always occur above the highs of the range, any deepening of the price to the lower value could seriously jeopardize any bullish approach.
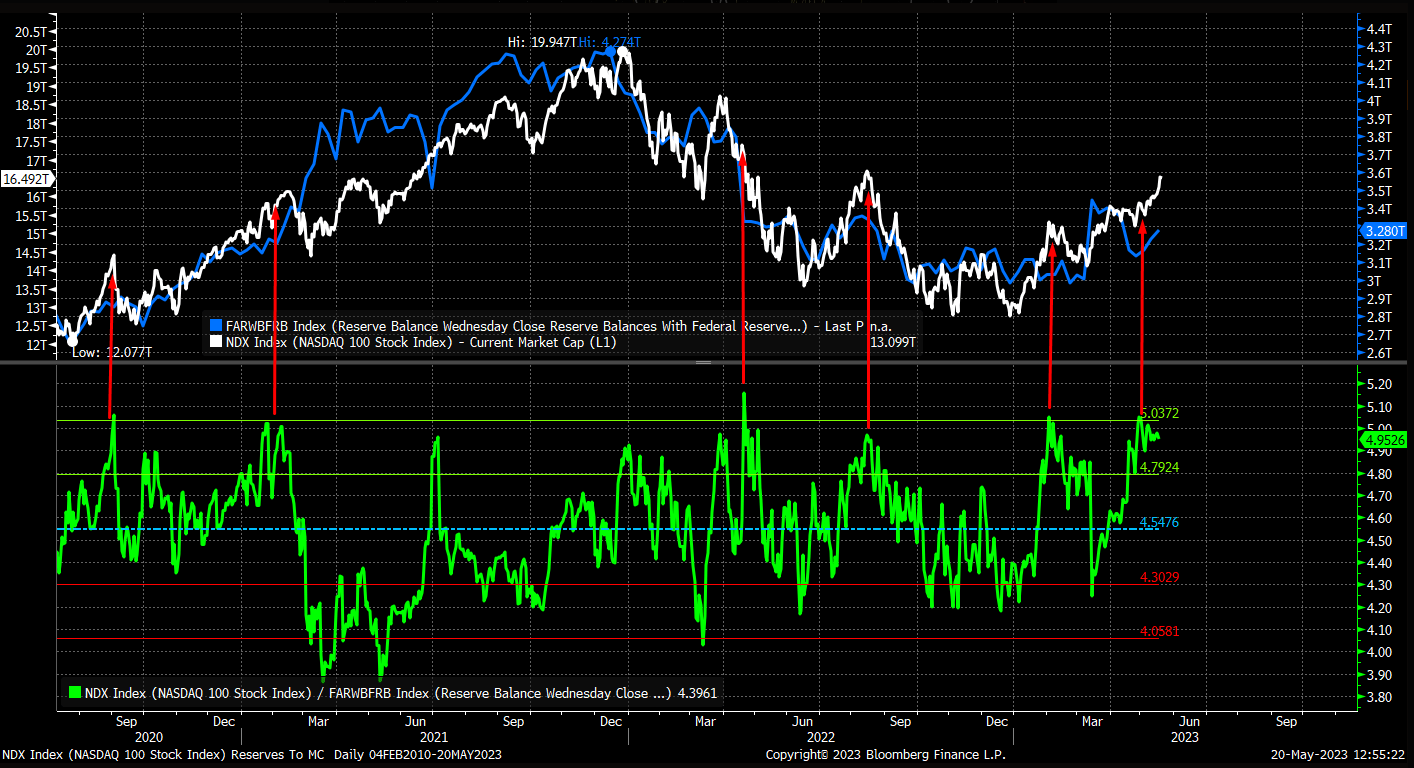
We are very expectant about the evolution of risk assets following the debt ceiling agreement. An agreement means the Treasury will be able to refill the Treasury General Account (TGA), this will suck a tremendous amount of liquidity out of the markets. Liquidity is probably the most important variable in these times for risky assets. This chart speaks for itself. Bitcoin vs Wresbal (Reserve Balances with Federal Reserve).

Dominance of Bitcoin supply has seen a dramatic shift over the last two years. US entities are now holding 11% less $BTC than they were in June 2022, whilst investors active during Asian trading hours have picked up 9.9%. This is a distinct reversal from the 2020-21 bull cycle.

Ethereum 29/05/23 4h chart

Ethereum 05/06/23 4h chart
No change for Etherum since last week. Ethereum is in the process of consolidating above the important zone discussed in previous newsletters. The Vwap anchored at the highs is a hard resistance zone, as seen in the chart, we would like to see a good sign of demand strength crossing this Vwap. Time now begins to play against it, since the conquest of an area has to be accompanied by subsequent strength to undertake a price discovery.
Crypto trading volumes unusually low
Data from on-chain analytics shows that non-stablecoin digital assets have seen historically low levels of monthly trading volume of late, with Bitcoin and Ethereum, in particular, dropping to the second-lowest threshold since 2019.
Daily trading volumes are lower across the board as crypto finds itself stuck in a relatively sleepy market. The Block's data dashboard indicates that the 7-day-moving average for crypto exchange volumes has hit its lowest level since the beginning of the year.

The decline in volumes follows news that major trading firms are scaling back their activity in the market. On May 9th, Bloomberg reported that Jump and Jane Street have pulled back from crypto trading because of regulatory uncertainty in the U.S. Jane Street, for its part, is scaling back globally, according to the report.


Transfer volume settled across the Bitcoin network has declined by a large margin since the highs seen in 2021. Overall, transfer volumes fell 85,5% from a cycle high of $13,1 billion to a low of $1,9 billion. Exchange volumes also saw similar declines, with deposit volume declining 91,8% from a May 2021 peak of $4,2 billion to a low of $343 million today. It is important to highlight that volume throughput is very low right now, indicating an arguably lackluster inflow of new demand, as well as growing dominance by low volume ordinal/inscription transactions.
The exit in trading by Jane Street and Jump Crypto, has the potential to disrupt the fragile flow of liquidity across the industry. Liquidity has still not recovered from Alameda's collapse, and a slowdown with two of the biggest surviving market makers could weigh on liquidity even further. We might see it in the future if brokers, payment providers and other actors looking to source liquidity start shifting offshore or to Europe and Asia.

Market depth, a metric used to measure liquidity on exchanges by assessing how much capital is required to move a market, slumped by more than 50% following the collapse of FTX and has failed to recover despite a rise in crypto prices. The more illiquid the market is, the bigger the price jumps can be to both the upside and downside.
This decline in overall liquidity is paired with a heavy decline in stablecoin trading volume, which according to CCData fell in May by 40,6% to $460 billion. This represents the lowest monthly trading volume by stablecoins on centralized exchanges since December 2022.
DEXs share of trading volume in the spot market exceeded 20% for the first time. We could say that the main reasons for this increase in trading activity on DEXs and decline in CEXs are the U.S. crackdown and regulatory uncertainty seen in many countries and a surge of interest in meme coins, many of which are traded on decentralized exchanges only.


In recent months, investors have been withdrawing their funds from centralized exchanges, causing many to experience record outflows. Even Binance, the largest cryptocurrency exchange by trading volume, was not immune to this trend. DEXs have been showing a bullish trend in trading volumes, with Uniswap and SushiSwap leading the way.
Decentralized exchanges are still in their early stages of development. They can be more complex to use than centralized exchanges and have less liquidity, which can make it harder to find trading pairs and execute trades. Despite these challenges, the growth of decentralized exchanges over the last few years has been impressive. The rise of DeFi and the increasing awareness of the risks associated with centralized exchanges will likely continue to drive the growth of decentralized exchanges in the coming years.
Tether's market capitalization hit an all time high even though trade volume is at multi-year lows.On both CEXs and DEXs, daily USDT volume averaged around $7bn in May. A Kaiko report last month raised suspicion about what it termed USDT’s “inordinate” market cap surge because the increase was inconsistent with a plunge in trading volumes to multi-year lows. Other stablecoins’ market cap has generally correlated with trading volumes.

From Glassnode: “We can see major shifts underway in stablecoins, with USDT supply at new ATHs, whilst USDC and BUSD fall to multi-year lows. Given stablecoins are non-interest-bearing, and regulatory pressure in the US is building, it suggests US capital is now less active in digital assets.”

If we look at exchange on-chain flows, we also see considerably weaker demand since April.Stablecoin inflows massively offset $BTC + $ETH inflows in Q1. However we now see larger $BTC + $ETH inflows (assumed sell-side) relative to stablecoins as the market corrects lower.

The market as of today is completely dominated by derivatives, we believe that organic growth from spot is absolutely necessary although the development of derivative markets is a sign of market maturity. Cryptocurrency derivatives trading volume on centralized exchanges fell in May, but spot trading volume declined even more, pushing the derivatives market share up to a new all-time high.

The market share of crypto derivatives trading rose to a record 77,6% even as absolute derivatives trading volume slid 23,3% to $2,15 trillion. Pushing the market share higher was a 40,2% tumble in spot volume to $621 billion.

The options market is one of the fastest-growing sectors in the cryptocurrency industry. Options trading volumes have increased across global crypto exchanges, with institutional investors increasingly trading crypto options to hedge their books. According to the latest report by Glassnode, the amount of Open Interest (OI) in Bitcoin Options contracts has reached $10,3 billion. Its futures contracts, on the other hand, stood at $10 billion, indicating that the amount of OI in Bitcoin Options contracts has surpassed the futures contracts for the first time ever.

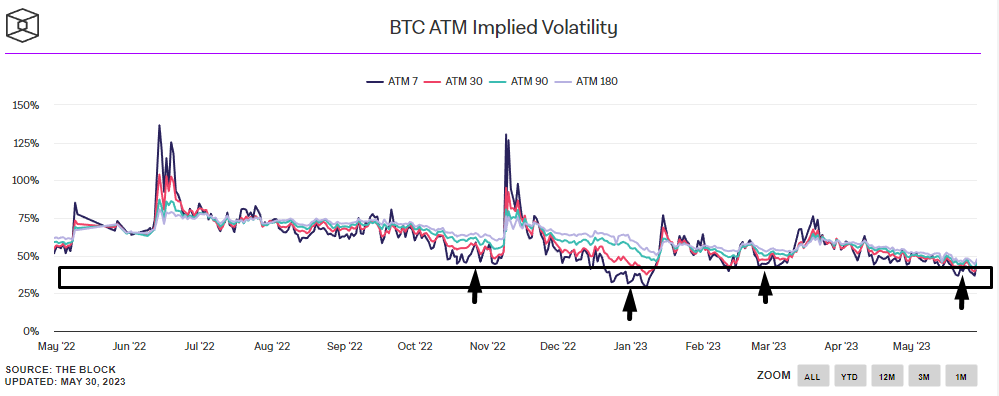
Options implied volatility is extremely compressed, falling to around 40% for both BTC and ETH, which is the lowest we have seen in many years. Far from being a reflection of maturation and stability, this fall in implied volatility is largely the combined result of the abrupt reduction in the number of large, sophisticated market participants and the increased hurdles to fiat on/off-ramps, leading to significantly lower volumes and higher volatility across all major coins.
Classic markets
Last week we commented: “..We will continue with a long bias but with little upside (4300 points) and we will be very aware of the market's GEX flip, currently at 4157.5 points…” After a bullish Thursday and Friday with completely vertical rises, we have reached the 4300 point zone. For this week we will not propose scenarios, as we need to observe if the market consolidates the 4250-4300 zone or if it experiences a strong rejection. Short scenarios will not come into play until the gamma flip point at 4182.5 points is broken. There is no need to stand in front of the train approaching at full speed or to board a train that is completely full and does not seem to know its final destination.
22/05/23 SP500 futures big picture

29/05/23 SP500 futures big picture

05/06/23 SP500 futures big picture

Gamma Profile 29/05/22

Gamma Profile 05/06/22

Observing the strong positive gamma exposure (GEX) that the market is dragging, we insist once again that it certainly seems difficult for the market to break above 4300 without first unloading the fomo experienced during the past week. In our opinion, the market has no tailwind for further rises due to the overexposure / concentration and the prevailing fomo coupled with an inevitable reduction in liquidity following the debt ceiling agreement.
According to the SPX gamma curve, we are at maximum positive gamma. In this situation the market should experience serious difficulties to continue upwards. We will keep a close eye on the gamma flip level, located at 4182.5 points. This level could radically change the market context and make volatility kick in.

Best start to the year for NASDAQ since 1999
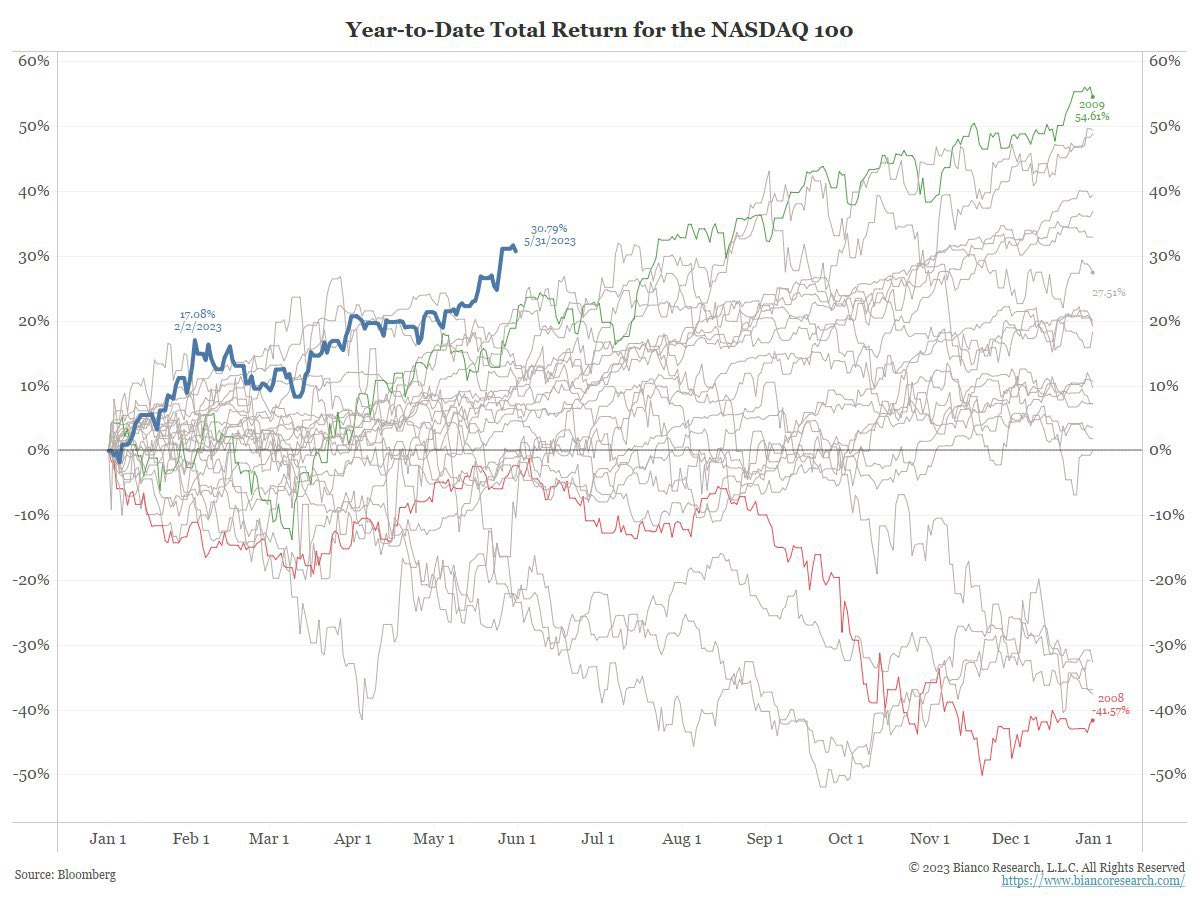
Record inflows into tech are being driven by a frenzy surrounding artificial intelligence

The frenzy surrounding artificial intelligence is driving US tech stocks back to high levels relative to small caps

Nasdaq market cap has traded between 4 to 5 times the size of the reserve balance and now is currently trading at 4.95. The last times the ratio had gotten this high was in late March 22, Aug 22, and Feb 23; each of those times ended with heavy declines.
The top 10 make up 34% of the S&P 500 now.

More than 100% of SPX market cap gains this year have been driven by just 7 stocks with 3 stocks accounting for nearly 70%....S&P 500 is up 9.1% led by Tech (+30%) while Russell 2000 is down 0.8% and the equal weight S&P 500 is 1.1% lower.


