.png)


.png)
Summary
The major benchmarks closed lower in a holiday-shortened trading week. The Nasdaq Composite suffered its first weekly decline in two months, while the S&P 500 Index recorded its first drop in six weeks.Worries about rising interest rates, along with softness in Asian and European markets following another round of poor manufacturing data, have the market on pace for a losing week. Still, major indexes remain near recent 14 month highs.
European data released overnight showed persistent softness in the manufacturing industry as interest rates keep rising, and all the major European stock markets are down substantially last week. The losses there likely played a role in Wall Street's struggles over recent days. Asian markets also had a rough time the last few sessions and are down sharply from a week ago. The S&P 500 is up over 14% year to date, albeit still largely driven by a handful of sectors and large-cap technology stocks and supported by investor enthusiasm around the emerging artificial intelligence (AI) sector.
In prepared testimony before Congress on Wednesday and Thursday, Fed Chair Jerome Powell stated that “nearly all policymakers expect that it will be appropriate to raise interest rates somewhat further by the end of the year.” Indeed, the Fed’s latest Summary of Economic Predictions revealed that a majority of those on the policy committee expect at least two more quarter-point rate hikes in the coming year, although futures markets continued to predict that was unlikely.
The Bank of England and Norway’s central bank, had accelerated their pace of rate hikes also seemed to intensify rate fears.
Cryptocurrency prices rose again Friday as bitcoin continued its rally to end the week. Bitcoin leapt 17% over the past seven days and is trading at its highest level in over a year as major investment firms seek regulatory approval for BTC offerings. Fund managers Invesco and WisdomTree refiled applications with the SEC for spot bitcoin ETFs late Tuesday. The world's largest asset manager BlackRock filed for a bitcoin exchange-traded fund with the SEC last week.
Another big development supporting the market was the announcement that EDX, a cryptocurrency exchange for institutions, was opening for business. Backed by traditional-finance heavyweights including Charles Schwab, Citadel Securities, Fidelity and Sequoia Capital, the exchange offers trading in four cryptos: bitcoin, ether, litecoin and bitcoin cash. It differs from entrenched competitors in operating on a noncustodial model that bars it from taking possession of the assets it lists.
This week will be the last of the month, of the quarter and of the first half of the year, and it comes loaded with sensitive data for the market; U.S. housing, U.S. GDP, consumer sentiment and PCE Price Index, the Fed’s preferred inflation gauge.
Macro and news

U.S Macro data
Much of the week’s economic data seemed to deepen worries that tight monetary policy was pushing the U.S. into recession. On Friday, S&P Global reported that its gauge of U.S. manufacturing activity had fallen back to its lowest level since December and well below consensus estimates. The report also showed that suppliers were cutting prices at the fastest pace since the heart of the pandemic lockdown in May 2020, presumably in response to weak demand.

The S&P Global US Manufacturing PMI fell to 46.3 in June 2023, pointing to the biggest contraction in the manufacturing sector since December, compared to 48.4 in May and forecasts of 48.5, preliminary estimates showed.

Leading indicators of inflation continue to trend lower, including the ISM prices paid indexes for both manufacturing and services.

The U.S. economy has defied expectations and ongoing calls for a recession, even as the Fed has raised rates aggressively over the past 16 months and as the yield curve has been inverted since last July. This is in large part due to the resilience of the labor market, which still boasts an unemployment rate of 3.7% (near multi-decade lows) and healthy wage growth of 4.3%. The strength we see in the labor market is also partly a result of a pandemic distortion, many left the labor force during this period, and certain industries still struggle to find workers, especially those in sectors that require in-person and frontline workers.
Although Fed Chair Powell insisted to Congress that the labor market remained tight, the number of Americans who applied for unemployment benefits last week was flat at 264,000, leaving it at a nearly two-year high and possibly signaling some decay in the U.S. labor market.

We are starting to see early signs that the labor market, and the economy, may be cooling. Some leading indicators of the labor market point to a pending softness, including rising jobless claims, lower quits rates, and falling job openings.

However, looking at the historical series, it seems that the employment data are in line with historical events following curve inversions. As we always insist, the macro issue has its lag.

The housing sector showed some surprising strength, with housing starts coming in at their highest level in over a year and well above forecasts. Sales of existing homes also surprised modestly on the upside. The 291,000-unit increase in starts was the most since January 1990, and the 21.7% rise was the largest percentage gain since October 2016.


However, as usual in these times, something is not fitting in the real estate sector. In real CPI-adjusted terms, the indicative cost of servicing a new mortgage is at a 40-year high.

Fourteenth consecutive month of declines in the Conference Board's leading indicators. The Conference Board's Leading Economic Indicators (LEI) continued their decline in May, falling 0.7% month-over-month (slightly better than the 0.8% decline expected).The largest positive contributor to the leading index was building permits at 0.15 percent month over month.The largest negative contributor was average consumer expectations, down -0.29% month over month.
This is the 14th consecutive monthly decline (and 15th month out of 17), the longest streak of declines since "Lehman" (22 straight months of declines from June 2007 through April 2008). It is evident to think that rising interest rates, coupled with persistent inflation, will continue to dampen economic activity.

J.P. Morgan expects household excess savings to be depleted by the end of the year. Consumption is 70% of US GDP and banks are beginning to restrict credit not only because of the Fed's rate hike but also because of the collateral effects of the regional banking crisis in the US.


The fear of a US banking crisis has largely faded from market sentiment, but it seems there's a steady, low drumbeat of distress among some firms. The amount of money lent out under the Fed's emergency lending facility rose for a sixth straight week, remaining above $100 billion.

Bank stocks eye worst week since May as regulatory waves loom. After rallying for the better part of a month since hitting their lowest level in more than two years, banking shares once again find themselves under pressure, with the Federal Reserve eyeing sharply higher capital requirements for the biggest lenders. The KBW Bank Index and KBW Regional Banking Index each fell at least 5% this week, their worst weeks since early May, when JPMorgan Chase & Co. agreed to acquire First Republic Bank following its failure.
$1.5T out of total $2.9T CRE loans to be refinanced in next 2 years, regional banks are responsible for 67%.


The evolution of the Fed Futures Forward Curve is a clear example between what the market wants and what is reality. Unfortunately, the market is not the economy, macro takes time and lives on the fringes of exigency and immediacy. The FOMC has indicated in its June projections that the peak fed funds rate may get to 5.6%, implying two more rate hikes from here. However, markets are pricing in one more hike at the July meeting, before pausing for the rest of the year.

Eurozone macro data
Eurozone business output grew for a sixth month in June but almost stalled, pointing to renewed weakness in the economy after the recovery in the early part of the year, according to a purchasing managers’ survey data provided by S&P Global.

The HCOB Flash Eurozone Composite Purchasing Managers Output Index fell to a five-month low of 50.3 from 52.8 in May.

German producer prices rose in May at their slowest pace since July 2021, a sign that inflation may be easing. Annual producer prices climbed 1.0%, down from 4.1% in April.

UK macro data
The BoE unexpectedly raised its key interest rate by half a percentage point to 5.0%, the highest level since 2008. The Monetary Policy Committee (MPC) voted 7–2 to step up the pace of policy tightening after the latest inflation data came in unexpectedly strong.

After last week hot inflation data, the market priced a 6% terminal with no pauses nor cuts

Headline annual consumer price growth failed to slow down for a fourth month running in May, sticking at 8.7%. Core inflation, which excludes volatile food and energy prices, accelerated to a 31-year high of 7.1% from the 6.8% registered in April.


Swiss-Norwegian macro data
Norway’s central bank increased its key interest rate by 0.5 percentage point to 3.75%, the highest level since 2008, and indicated that it “will most likely” hike again in August to curb inflation that is “markedly above target.” The Swiss National Bank raised its benchmark interest rate by a quarter percentage point to 1.75%, the fifth consecutive increase, and did not rule out additional rate increases.
Japan macro data
Japan’s stock markets retreated from their 33-year highs, with the Nikkei 225 Index falling 2.7%. Japan’s hot May core consumer inflation print weighed on sentiment, and fueled speculation that the Bank of Japan (BoJ) would revise upward its inflation forecasts in July. Comments by BoJ board member Seiji Adachi appeared to rule out the chance of a tweak to the central bank’s yield curve control policy at its meeting next month, although the BoJ has previously suggested that a certain degree of surprise may be unavoidable.
Japan’s core consumer price index (CPI) rose by 3.2% year on year in May, more than forecast; the number slowed from the previous month but remained well above the BoJ’s 2.0% inflation target. While the target has been surpassed every month for more than a year, the central bank has stuck to its projection that the year-on-year rate of increase in the CPI is likely to decelerate toward the middle of fiscal 2023.

The yen weakened to about JPY 143.1 against the U.S. dollar from about JPY 141.8 previously. The currency slumped toward the levels that prompted Japanese policymakers to intervene in the foreign-exchange market late last year to halt its decline. Finance Minister Shunichi Suzuki said he was closely watching foreign exchange rates and that sharp currency moves were undesirable.
China macro data
No major indicators were released in China during the week. However, mounting evidence that the country’s recovery is losing steam raised fresh concerns about the economic outlook. The lackluster results in recent weeks have led economists at several key banks to lower their 2023 growth forecasts for China, which is struggling with slowing export demand, a yearslong housing market slump, and weak business and consumer confidence.
Chinese banks lowered their one and five-year loan prime rates by 10 basis points for the first time since August 2022 as expected, after the People’s Bank of China (PBOC) cut its medium-term lending facility rate last week.

Crypto News
=> BlackRock, WisdomTree, Invesco, Valkyrie, and Fidelity Investments this week, filed for a bitcoin exchange-traded fund (ETF) that would allow investors to get exposure to the cryptocurrency, as the asset class comes under intense regulatory scrutiny. The impact of these filings on the crypto market is undoubtedly huge, and its growing adoption seems to be inevitable. The largest cryptocurrency is up over 16% since the news broke, as investors are seeing growing acceptance and adoption of digital assets by traditional finance giants.
=> Another big development supporting the market was the announcement that EDX, a cryptocurrency exchange for institutions, was opening for business. Backed by traditional-finance heavyweights including Charles Schwab, Citadel Securities, Fidelity and Sequoia Capital, the exchange offers trading in four cryptos: bitcoin, ether, litecoin and bitcoin cash. It differs from entrenched competitors in operating on a noncustodial model that bars it from taking possession of the assets it lists.
=> This shift in institutional sentiment comes after the early-June crackdowns on Binance and Coinbase, the two largest cryptocurrency exchanges. The SEC issued civil complaints against both for acting as unlicensed exchanges and listing cryptocurrencies that it considers unregistered securities, additionally charging Binance with engaging in a multi-step plan to surreptitiously evade U.S. laws.
One big gainer in the current surge is bitcoin cash, which rose 31% on Friday and 66% for the week. Its inclusion as one of the inaugural EDX listing was the clear catalyst for that rise. Being listed alongside BTC and ETH suggests that institutional players think BCH is likely to be considered a commodity rather than a security. Bitcoin cash is built on the same blockchain as bitcoin, but it can process transactions much more quickly. That makes it faster and cheaper to use, but at the potential expense of security.
=> Fed Chair Powell In his testimony to the House Financial Services Committee last Wednesday, called stablecoins "a form of money". He also urged that there was a need for central bank oversight in order to create stablecoin regulation. Powell stated, "We do see payment stablecoins as a form of money, and in all advanced economies, the ultimate source of credibility in money is the central bank. We believe it would be appropriate to have quite a robust federal role."
The Fed Chair also talked about the potential of a Central Bank Digital Currency (CBDC) but provided a disappointing answer stating that the US was a long way from making this happen. On the prospect of a CBDC existing, Powell said that the central bank would not be managing retail accounts, these accounts would be managed through the country’s banks.
Powell further discussed the creation of legislation for cryptocurrencies and noted that two crypto bills are expected by July. Once the bills are through the debate and edit process, they would go forward for a Committee vote. This would bring regulation to the crypto market, which Powell stated had staying power as an asset class.
=> Last June 16, one of the most important banks in Spain, Banco Santander, published in its official blog, an article about the scalability solution built on Bitcoin: Lightning Network (LN). Banco Santander notes that traditional companies such as Shopify and McDonald's have also adopted the decentralized system designed to process high volumes of instant micropayments and solve the scalability problem faced by the Bitcoin network. This is the first time that the institution publishes information regarding the Bitcoin network on its official website, which demonstrates the degree of acceptance and relevance that bitcoin is having within financial institutions.
=> Banking giant Deutsche Bank AG has applied for regulatory permission to operate as a crypto custodian in Germany, the bank said Tuesday. The move came just days after asset management giant BlackRock filed with the SEC to create a spot bitcoin ETF.
=> Ethereum core developers plan to implement a 64-fold increase in the maximum amount of staked Ether required to become a validator, from 32 ETH to 2048 ETH while the minimum staking amount remains at 32 ETH. The proposal was made during a June 15 Ethereum core developer consensus meeting by Ethereum Foundation researcher Michael Neuder. The researcher noted that although the current limit of 32 ETH allows more validators to join the Ethereum network, making it more decentralized, it also leads to an inflation of the validator set size.
Cryptos: spot, derivatives and “on chain” metrics
The price of bitcoin jumped above $30,000 following a series of recent applications from traditional financial firms. Investors are growing bullish about the prospects of BlackRock and other major institutional names getting involved in digital assets. The slate of spot bitcoin ETF application announcements by larger institutions has definitely brought back bullishness into the crypto markets.
These recent advancements have translated into a substantial influx of capital into the crypto market, an impressive $200 billion has flowed into the cryptocurrency market within the span of just one week.

Gainers / Losers last 7 days, block size volume

In last week's newsletter we noted the following: “The ball is in the bulls' court, if they want to turn this situation around they must conquer in a vigorous way and showing real strength the Vwap anchored at the local highs and the high volume node $28100”. Such a show of strength has been given with tremendous vigor.
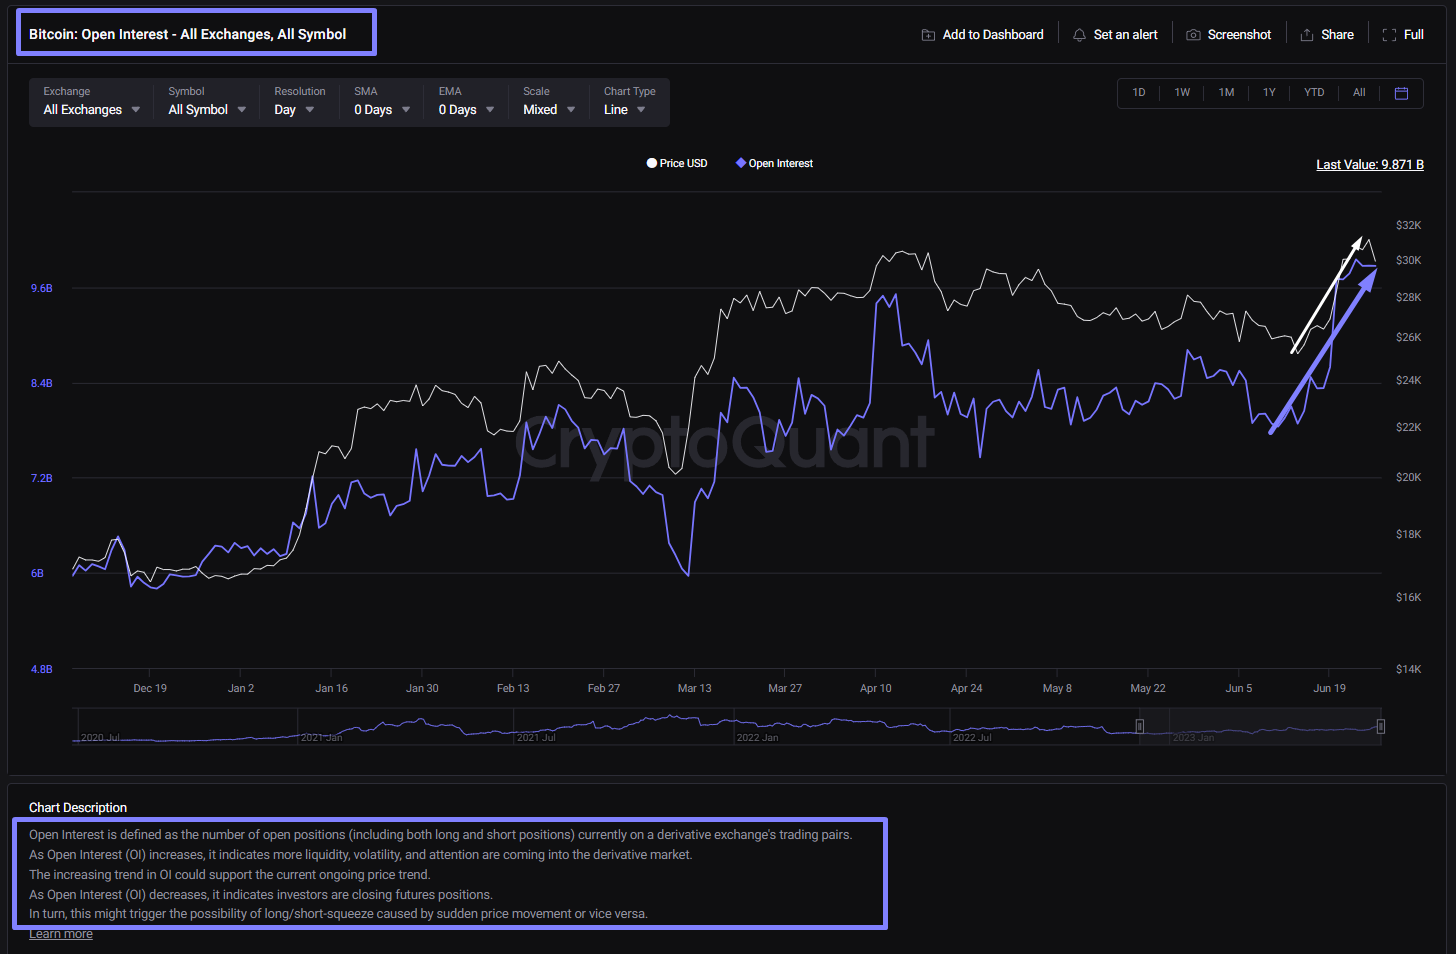
The market has managed to break the Vwap anchored at the local highs and the High volume node at $28100. Now remains the next big step, the consolidation of this battle won by the bulls. We expect this week some retracements and more considering the high leverage present in the market and the strong increase in open interest. Retractions to the Vwap anchored at the previous local highs and high volume node of $28100 are perfectly feasible and would not spoil the long scenario.
Bitcoin 19/06/23 30 min chart

Bitcoin 26/06/23 30 min chart

Moving up the timeframe, the scenario of effective bullish imbalance of the entire lower value area gains strength. The verticality of the rise leaving a somewhat inefficient auction and the clash with the third typical deviation of the main Wwap are the only impediments to further upside for the time being.
As we have said before, the conquest of the Vwap anchored at the previous local highs and the HVN of $28,100 would open the door again to a clear medium-long term long scenario.
Bitcoin 19/06/23 4h chart

Bitcoin 26/06/23 4h chart

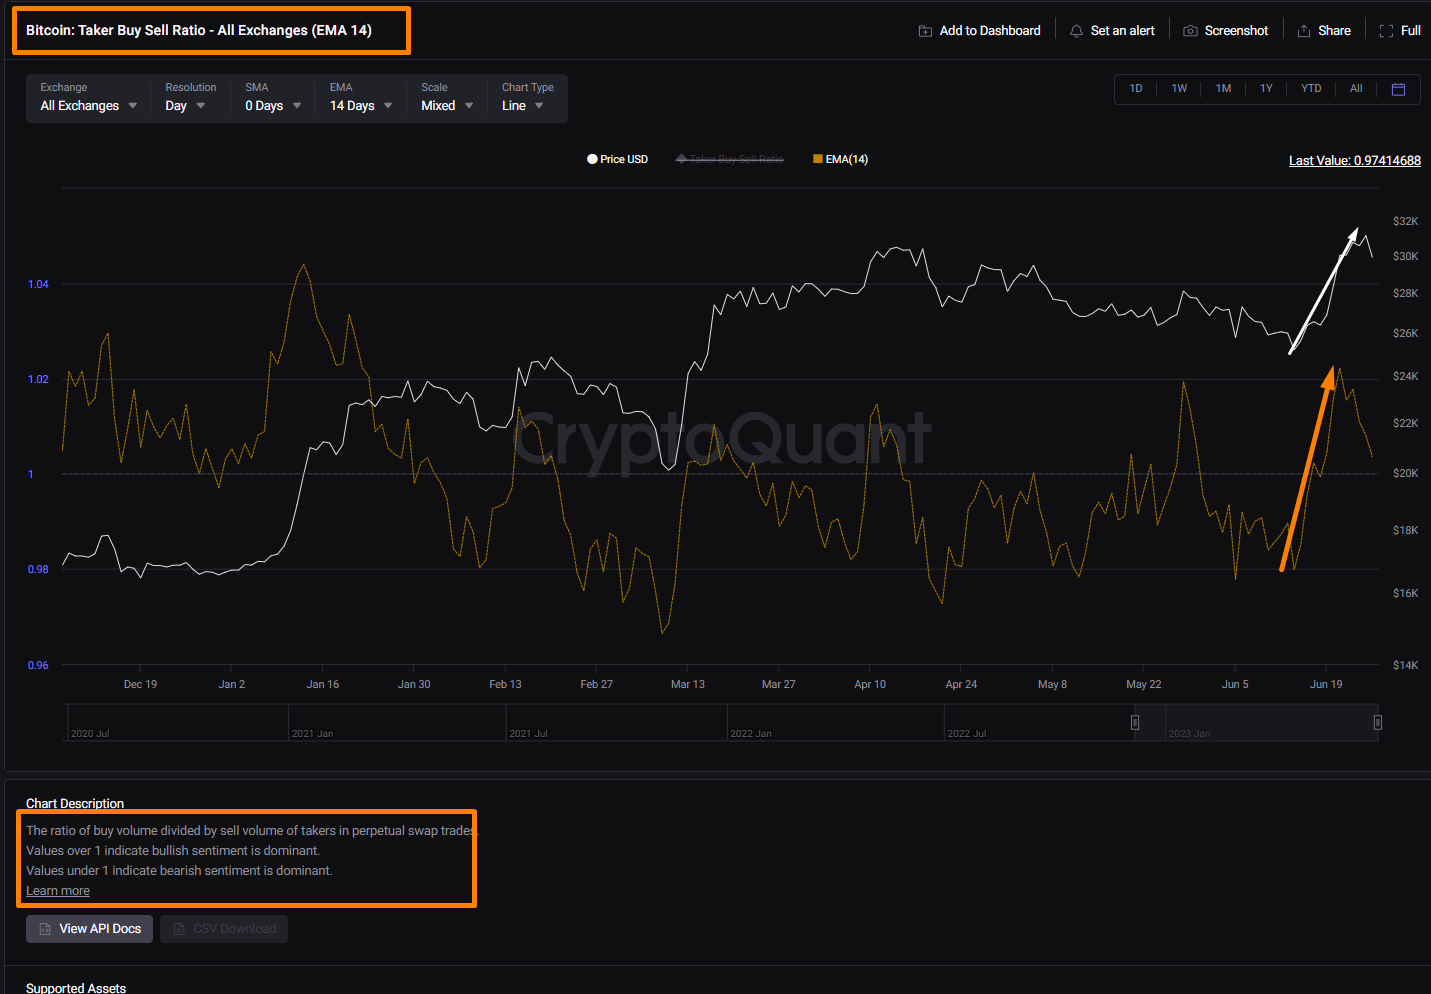
However, diving into on-chain metrics, the recent momentum is not due to an explosion of interest in spot but has clearly been led by stablecoin margin futures. Leverage, open interest and taker buy / sell ratio give us a clear clue about it.

Stablecoin margin futures CVD (cumulative delta volume) leading well ahead of spot and coin margined futures


On the day of BTC's big rise, increased derivatives volume makes spot volume negligible. 47 billion volume in futures vs. 4 billion volume in spot in the last 24 hours and all practically in Binance

Let's delve deeper into whether there were relevant stablecoin inflows in the derivatives exchange and if there is any relationship in the subsequent movement.


How curious that the 1B increase in TUSD market cap on June 16 has a 1:1 correlation with the increase in BTC market cap and how curious also those inflows of stablecoins in derivative exchanges later on.

It is up to the reader to assume whether this recent explosive movement is due to organic spot purchases. What is not in doubt is that this move has been cooked up and executed with stablecoin futures, which makes us very cautious. A bull market can start in this way, without any doubt, but it has to be accompanied later by organic spot purchases.
In the last analysis we remarked that: “Demand must react in this area to prevent sellers from taking control again and even more so after rejecting the Vwap anchored at all time highs”. The reaction has been in the expected area, the bulls have reacted, however, in order to propose an analysis with a solid long approach, we continue to insist that the market must consolidate and conquer the Vwap anchored at maximums
Ethereum 19/06/23 4h chart

Ethereum 26/06/23 4h chart

We will closely monitor the evolution of BNB as a measure of risk perception. BNB is the cryptocurrency coin that powers the BNB Chain ecosystem. BBN is one of the world's most popular utility tokens and it is used primarily to pay transaction and trading fees on the Binance exchange. It is Binance's flagship token.
At first glance we note that the Vwap anchored at highs has never been exceeded or practically tested since late 2021. The vigorousness with which the Vwap anchored at the local lows of June 2022 has been broken through makes us aware of the major weakness on this token. Clearly the area to watch is the historical support at $220, from there Binance could be in serious trouble. There has not been a strong market reaction after testing this level for the last two weeks, as long as the market continues to hover in this zone, the danger is on the table.
BNB 19/06/23 4h chart

BNB 26/06/23 4h chart

Classic markets
The market positioning still remains stretched and we have the end of the month and end of the quarter next week. This is when funds rebalance their books and it’s quite likely this is what we’ve been seeing last week and that we will see some further selling into the month-end, because equities have run up significantly causing an imbalance.
The rotation during the week seemed to suggest quite a bit of risk off. It also suggests some profit taking and rotation to defensives as we head into the 2H of the year, with the Fed signaling two more rate hikes and global Central Banks continue with their hawkish tone.
NASDAQ valuations have surged at the third fastest pace in the last two decades! Will tech stocks grow into these lofty multiples or will we see a re-rating of risk?

AI-related stocks account for most of the gains in the S&P 500 year-to-date.


For the first time ever the yield on cash, bonds and equities is the same. If you are a US investor you should probably buy bonds because in risk-adjusted terms they give you more.

Tech saw the largest Outflow in 10 weeks.

It's funny how fast investor sentiment can do a complete 180-degree turn. Late last year, Wall Street was extremely pessimistic on technology stocks. Shares of popular names like Amazon, Tesla, and Meta Platforms were down more than 50% in less than a year after going on an incredible bull run the past decade-plus.
In the first few months of 2023, most of these losses have been reversed. We have the artificial intelligence (AI) hype train to thank for this, as everyone seems enamored with the recent breakthroughs from companies like OpenAI and Alphabet, which have the potential to supercharge growth in the technology sector yet again.
Mega-cap tech stocks look expensive compared to the rest of the S&P 500.


Retail investors purchased $1.5 billion of single stocks for the week which is an ALL-TIME record and of course most of that capital went into 3 names.

0DTE SPX options volume still accounts for over 40% of all options traded within the index.


S&P 500 options skew hovering near lowest levels of the year and far lower than most of 2021 and 2022.

The record length of the current rally suggests it's no longer a bear market rally and we're no longer in a bear market. So, this rally is something else. Many now say it’s the start of a new bull market. We strongly believe that it's a mini bull market forced by systematic price agnostic flows, leverage in options, fomo around the IA and by a market that refuses to accept that macro issues have a lag and that the effect of rate hikes have inevitable consequences on the real economy.

The famous weakness window after OPEX has had its effect, we were looking for retractions towards the 4375 area and the market gave it to us.
Again, we draw on the information obtained from the gamma profile of the market. The market is outside the gamma stack which ranges from 4375 to 4450 points. The key of the week will be to observe if the market is able to recover this zone of interest or if it experiences rejection when testing it. We have the gamma flip very close (4342.5), a rejection to the zone mentioned above and a break of the zero gamma level could trigger significant selling. However, we do not expect the market to deepen beyond 4320 until the JP Morgan collar trade expires on June 30.
19/06/23 SP500 futures big picture

26/06/23 SP500 futures big picture

Gamma Profile 19/06/22

Gamma Profile 26/06/22

Looking at a larger time frame chart, where we can observe the big picture, we can clearly see that the market achieved a great feat, consolidating above the Vwap anchored at all time highs and the main Vpoc of the composite. However, the subsequent movement after that feat shows climatic characteristics, where the price has been parabolically looking for the second higher standard deviation of the Vwap anchored at highs and already testing the third standard deviation of the Vwap anchored at local lows. All this has been done without any rest and dragging extreme metrics such as those mentioned above. A pullback seems to be inevitable and even healthy, in order to eliminate over-positioning and fomo. Markets do not rise vertically and relentlessly, especially not in such an excited way and led by price agnostic flows and strong leverage via options.
Bulls can certainly breathe easy as long as the market is above the Vwap anchored at highs and the headline VPOC.


