.png)


.png)
Summary
For the first time since early 2022, the Fed has left interest rates unchanged. As a result, the benchmark federal funds rate remains at 5% to 5.25%. While the Fed has paused on its rate hikes for now, Fed Chairman Jerome Powell suggested that we might see another two more rate hikes this year. Investors are now forecasting that the earliest that we might see a rate cut will be in 2024
We don't think this confirms the end of rate hikes, but instead offers an opportunity for the Fed to evaluate inflation and economic conditions before making further moves. We expect the Fed to continue to talk tough on its commitment to bringing inflation back toward its target, in an effort to ensure financial conditions don't loosen dramatically and reignite inflation pressures.
Despite signaling that there might be two further rate hikes later this year, investors were quick to sense that the end of this rate hike cycle might be near. This drove a rally in tech stocks, with the share prices of Nvidia and Microsoft reaching new all-time highs. There was also improved sentiment towards the Chinese market as a series of interest rate cuts led to expectations that China will be coming up with more measures to stimulate its economy.
The European Central Bank (ECB) raised interest rates by a quarter of a percentage point last Thursday and signaled another hike to come next month, unmoved by evidence of a mild recession in the 20 countries that use the euro. The ECB slowed the pace of its interest rate increases on Thursday but signaled more tightening to come in what markets expect to be the final stage of its fight against inflation. "We are not pausing, that is very clear," ECB President Christine Lagarde told a press conference. "We know that we have more ground to cover." Having raised rates by the most in its 25-year history, the ECB is moderating the pace of monetary policy tightening in light of data showing the euro zone economy is barely growing and that banks are turning off the credit taps.
We left behind this intense week of macroeconomic events with the “quadruple witching hour”, the single Friday each quarter when contracts for stock index futures, stock index options, stock options, and single-stock futures all expire. Big trading firms often have positions expiring on these dates, and the potential for big moves exists. Large baskets of stocks or futures are normally unwound, especially around the opening and closing times.
After this expiration date, the market enters the so-called "weakness window". During this period the market is free to move more freely due to the absence of these hedge flows from the options market. In our opinion and as we will explain below, the market has experienced a climatic event during the past week due to these dynamics in the options market. We are back to a quiet week on the macroeconomic front with markets closed on Monday for Juneteenth.
Big news also came from the crypto ecosystem. The world’s largest asset manager, BlackRock, is preparing to file a spot Bitcoin ETF application. The firm will collaborate with Coinbase for ETF custody services, the exchange’s spot market data for pricing. However, we are obliged to read the fine print, a Spot ETF would be the game changer as it would be open-ended. A trust is always closed-ended. Why that matters? Because trusts are limited in redemption, both works similar, but for the BTC price only redemption matters.
Documents obtained by CoinDesk and Bloomberg as part of a freedom of information (FOI) request have revealed more details about Tether reserves from March 2021, including which banks it relied on and who was issuing the commercial paper that dominated its reserves during this period. The quality of assets backing USDT has long been the subject of scrutiny because of the crucial role it plays in crypto markets. Traders use the stablecoin, which has a circulation of about $83.5 billion, to move money into and out of cryptocurrency markets, swap funds between exchanges and as a haven in times of high volatility. Should Tether be unable to redeem the tokens for dollars, confidence in crypto assets would be shaken. This new information will undoubtedly be very controversial in the coming weeks.
Macro and news

U.S Macro data
The Federal Reserve continues to follow its playbook to: hike, hold and recalibrate. After rapid rate hikes over the past 16 months that lifted the fed funds rate by the largest amount (500 basis points, or 5%) in more than four decades, the decision to pause at the most recent meeting signals a subtle shift to the "hold and recalibrate" phase. The Fed made it clear that the door is still open to more rate hikes, with the median estimate among the members suggesting another two rate hikes of 25 basis points each could be seen this year. However, with inflation trending down, growth sluggish and the financial system still dealing with the fallout of bank failures, a more cautious approach seems to be warranted.
Highlights from the FOMC and Chairman Jerome Powell's press conference are as follows:

During the last 30 years, core inflation averaged 2.4% when the Fed shifted to the sidelines and paused rates. Today, it's 5.3%, suggesting the Fed may need to restart the rate-hike engine. Prior pauses have come when core inflation is well below the fed funds rate, so we'll likely need to see inflation fall quickly or the Fed policy rate move higher (or a combination of both) before central bankers can fully confirm an end to the tightening phase.
The full effects of the aggressive rate hikes of the last year have yet to fully work their way through the system. In the 1960s, 1970s and 1980s, economic contractions commenced about the same time as the Fed policy rate peaked. However, since the 1990s, rates peaked several quarters before recessions emerged, demonstrating the lagged effects. At this point, it certainly seems impossible for the Fed to be accurate in reducing inflation and preserve the health of the economy perfectly.

In addition to moderating inflation, the case for a Fed pause is also supported by signs of deceleration in the broad economy. Manufacturing activity has been contracting for more than six months, and business investment has declined materially, two cylinders of the economic engine that are misfiring. This weakness has been masked within the overall GDP figure by an exceptionally strong consumer, supported by very low unemployment and elevated wage growth. However, the labor market is beginning to show signs of softening.


Last Tuesday, the Labor Department announced that the consumer price index (CPI) had increased at a Y/Y pace of 4.0%, still double the Federal Reserve’s target, but down from the prior month’s 4.9% and the slowest pace since March 2021. More importantly, core CPI, which strips out volatile food and energy prices and serves as the guide for monetary policy, continues to moderate. Core inflation fell to its lowest since November 2021, helped by declines in core services, such as airfare and recreation.

CPI 0.1% M/M, Exp. 0.1%, Last 0.4%
CPI Core 0.4% M/M, Exp. 0.4%, Last 0.4%
CPI 4.0% Y/Y, Exp. 4.1%, Last 4.9%
CPI Core 5.3% Y/Y, Exp. 5.2%, Last 5.5%


On Thursday, the Labor Department revealed that producer prices (PPI) had declined 0.3% in May, marking four declines over the past six months.

PPI -0.3 M/M; Exp. -0.1%
PPI 1.1% Y/Y, Exp. 1.5%
PPI Core 0.2% M/M, Exp. 0.2%
PPI Core 2.8% Y/Y, Exp. 2.9%
Investors received some good news on the consumer side of the economy. On an overall basis, retail sales rose 0.3% for the month and 1.6% over the past 12 months, marking the first year-over-year increase since January. Excluding the volatile auto and gasoline segments, sales rose 0.4% in May.

Eurozone macro data
The ECB raised its key deposit rate by a quarter point to 3.5%, the highest level in 22 years. ECB President Christine Lagarde said after the meeting that policymakers “still have ground to cover” and that they would probably tighten borrowing costs again in July, unless there was a “material change in the baseline outlook.” The ECB now expects inflation to remain higher for longer.
The ECB also raised its forecasts for headline and core inflation across the three-year time horizon, strengthening the case for continued monetary tightening. Core inflation is expected to reach 5.1% this year, up from an average of 4.6% forecast in March. The central bank also pared its estimates for economic growth, ECB now expects the economy to grow 0.9% this year, a marginal downgrade from its forecast in March. As part of an effort to shrink its balance sheet, the ECB confirmed that it would stop reinvesting the proceeds of its asset purchase program from July.
These are the main headlines from the ECB and President Lagarde's press conference:

Industrial production in the eurozone rebounded by a greater-than-expected 1.0% in April due to a strong increase in capital goods output.

UK macro data
A rebound in UK economic growth and stronger than forecast labor market data supported market expectations that the Bank of England (BoE) would continue raising interest rates in July. The economy grew 0.2% sequentially in April, after contracting 0.3% in March. Increased output in consumer-facing services, car sales, and education drove the gains. Separately, annual average wage growth, excluding bonuses, climbed to 7.2% in the three months through April, while the unemployment rate receded to 3.8% after rising to 3.9% in the three months through March.


Japan macro data
At its June meeting, the Bank of Japan left its ultra-loose policy settings unchanged, meeting investor expectations. By a unanimous vote, the central bank kept its short-term interest rate at -0.1% and that of JGB yields at around 0%. It also made no tweaks to its yield curve control (YCC) program, which allows JGB yields to fluctuate in the range of around plus and minus 0.5 percentage points from zero. However, BoJ Governor Kazuo Ueda hinted that when it comes to its YCC program, a certain degree of surprise may be unavoidable, in order to deal with the changing economic environment.


China macro data
The People’s Bank of China (PBOC) cut its medium-term lending facility rate by 10 basis points to 2.65% on Thursday, marking the first reduction since last August. The move was largely anticipated after the PBOC unexpectedly lowered the seven-day reverse repurchase rate, a short-term policy rate, by the same amount earlier in the week. The central bank also rolled over RMB 237 billion into the banking system compared with RMB 200 billion in maturing loans. Analysts predict that the central bank’s pivot toward stimulus may lead to targeted support for some industries as Beijing steps up measures to bolster the recovery.
A trio of indicators showed that China’s economic activity weakened last month. Industrial output, retail sales, and fixed asset investment grew at a slower than expected pace in May from a year earlier, according to official data. Expectations that China will be coming up with more measures to stimulate its economy are strongly increasing.
Crypto News
It's certainly been a big week in the crypto ecosystem, let's start with the following parts.
BlackRock’s iShares Has Filed For Bitcoin Trust
BlackRock, the world's biggest asset manager, on Thursday filed for a bitcoin exchange-traded fund (ETF) that would allow investors to get exposure to the cryptocurrency, as the asset class comes under intense regulatory scrutiny. BlackRock's iShares Bitcoin Trust will use Coinbase Custody as its custodian, according to a filing with the U.S. Securities and Exchange Commission (SEC). The U.S. regulator has yet to approve any applications for spot bitcoin ETFs.
The fact that BlackRock, a well-respected and established asset management company, has filed for a Bitcoin ETF could be seen as a positive development in the quest for regulatory approval. The SEC rejected Grayscale Investment LLC’s application last year to convert its flagship spot Grayscale Bitcoin Trust into an ETF. Grayscale sued the SEC, claiming that the regulator was acting arbitrarily in rejecting applications for spot bitcoin ETFs when it had previously approved bitcoin futures ETFs.
The SEC's approval/rejection of the Blackrock ETF would come by February 2024, within 240 days of filing in the Federal Register. The SEC has a maximum of 45 days from the date of filing to publish a notice of the application in the Federal Register. After this initial notice, there is a 45-day period for interested parties to submit comments, followed by an additional 45-day period for responses to those comments. The SEC may then extend the review period by up to 90 days, making the total review period up to 240 days. This extension typically occurs when the proposed ETF raises complex or novel issues that require additional time for thorough evaluation.
The SEC however has a long history of denying spot ETFs citing concerns about market manipulation and the lack of a surveillance-sharing agreement between a “regulated market of significant size” and a regulated exchange. There is some truth to this concern, as Coinbase and other American exchanges make up less than 10% of Bitcoin spot volume. There are genuine concerns to market manipulation, especially given the regulatory fire towards Binance.
In our opinion, the SEC will only let a spot ETF exist if there's a trusted exchange intermediary to oversee the market like the CME. So will Blackrock's request pass? not at all clear, Vaneck has filed 3 times already and even Fidelity was rejected.
Another important issue to consider is that BlackRock has filed for a Bitcoin Trust, not an ETF. The main difference between a Bitcoin spot ETF and a Bitcoin trust lies in their structure and regulatory status. A Bitcoin spot ETF is an exchange-traded fund that tracks the price of Bitcoin (fund holds the assets) and allows investors to gain exposure to the cryptocurrency without directly owning it. It operates similarly to traditional ETFs, with shares that can be bought and sold on stock exchanges throughout the trading day. Bitcoin spot ETFs require regulatory approval and typically adhere to the rules and regulations set by financial authorities.
On the other hand, a Bitcoin trust is a vehicle that holds Bitcoin on behalf of investors (maybe redeemable). It functions as a fund managed by a trustee, who oversees the storage and management of the Bitcoin assets. Investors can buy shares or units in the trust, which represent their ownership of the underlying Bitcoin holdings. Bitcoin trusts are structured differently from ETFs and often involve a direct investment in Bitcoin itself. Unlike ETFs, Bitcoin trusts may not trade on exchanges and may have limited liquidity.
The potential for a BlackRock spot Trust is a positive catalyst for BTC from a pure price per coin standpoint. The company has a monstrous $9.1 trillion in assets under management. If even just 0.1% of that wealth finds its way to BlackRock's proposed spot ETF without cannibalizing other BTC investment funds, it would be a $9 billion bid on BTC
For the time being, there has been a limited reaction from crypto markets to the BlackRock ETF news. Total capitalization is up just 1% to reach $1.07 trillion.
Binance, SEC strike deal to keep US customer assets in country
Binance, the world's biggest cryptocurrency exchange, and Binance.US have entered into an agreement with the SEC to ensure that U.S. customer assets remain in the United States until a sweeping lawsuit filed this month by the regulatory agency is resolved. The agreement, disclosed in court papers filed late on Friday, still requires the approval of the federal judge overseeing the litigation. To make certain that U.S. customer assets do not go offshore, the agreement allows only Binance.US employees access to these assets.
Under the agreement, which does not resolve the SEC lawsuit, Binance.US will take steps to make sure that no Binance Holdings officials have access to private keys for its various wallets, hardware wallets or root access to Binance US's Amazon Web Services tools, the court filings showed. The SEC said in a statement released on Saturday that the emergency relief order secured for Binance.US customers will protect their assets and ensure that they can continue to withdraw those assets.
The SEC on June 5 sued Binance, its CEO and founder Changpeng Zhao and Binance.US's operator, alleging that Binance artificially inflated its trading volumes, diverted customer funds, failed to restrict U.S. customers from its platform and misled investors about its market surveillance controls.
Binance to quit the Netherlands and faces investigation in France
Binance is leaving the Netherlands, after failing to persuade the Dutch regulator to issue a virtual asset service provider (VASP) license, which attests that it meets anti-money laundering (AML) guidelines. Binance said that from 17 July, Dutch residents would only be able to withdraw their assets from the platform and further trading or deposits would not be possible. It advised users in the Netherlands to withdraw funds from their accounts.
In France, Le Monde newspaper reported that prosecutors were investigating Binance because of its anti-money laundering procedures and the fact that it advertised its services in the country before it was registered with the financial markets regulator. Binance was registered with France’s Financial Markets Authority in May 2022.
Europe has generally been receptive to crypto exchanges and their anti-money laundering efforts. Binance is already AML compliant in France, Italy, Spain, Poland, Sweden and Lithuania. Last week, the exchange said it planned to leave Cyprus to focus on becoming fully compliant with the new European Union rules on crypto-assets (MiCA).
Curve pool imbalance triggers USDT depeg concerns
On June 15, an imbalance in Curve Finance’s 3pool led to a Tether depeg scare as the stablecoin’s weightage in the pool rose above 70%, leading to heavy selling. Tether’s chief technology officer claimed these market conditions are stress tests for the stablecoin and played down the depeg “FUD.”
Curve’s 3pool is a stablecoin pool for decentralized finance holding a massive amount of liquidity in the three top stablecoins: USDT, USDC and DAI. A significant rise in the weightage of a particular stablecoin in the pool indicates heavy selling of that asset.
Tether Was Once Backed by Chinese Securities
Source: Protos
https://protos.com/heres-what-new-tether-documents-reveal-about-its-reserves/
Documents obtained by CoinDesk and Bloomberg as part of a freedom of information (FOI) request have revealed more details about Tether reserves from March 2021, including which banks it relied on and who was issuing the commercial paper that dominated its reserves during this period.
Tether has previously shared the makeup of its reserves for this period with several news outlets. This included a pie chart that revealed that Tether had approximately half of its reserves in commercial paper. Several months later, Tether faced accusations that its reserves included commercial paper related to beleaguered Chinese property developer Evergrande, which it would categorically deny.
The documents reviewed don’t show any commercial paper from Evergrande, but do include a variety of other Chinese entities including, but not limited to:
The Agricultural Bank of China
Bank of China Hong Kong
Bank of Communications
Industrial and Commercial Bank of China
China Merchants Bank
China Construction Bank
China Everbright Bank
China Development Bank
Previous investigations, including by Bloomberg, claimed that Tether had significant exposure in its securities portfolio to entities in China.
Later, in July of last year, after a significant reduction in the amount of commercial paper in its portfolio, Tether announced that it had no exposure to commercial paper from Chinese entities.
The documents also show a variety of other banks including, but not limited to:
Qatar National Bank
Banco de Sabadell
Barclays Bank
Commercial Bank of Qatar
Deutsche Bank
Kredietbank
Japan Post Bank
Bank Communications NY
Outside of banks, Tether also held securities issued by other entities including:
Land Securities PLC
Walt Disney Company
General Motors Financial Company
Renault
Louis Dreyfus Company
The reporting also provides additional context on Tether’s banking relationships, pointing out it was using Ansbacher (since acquired by Deltec), Deltec Bank and Trust, Capital Union Bank, and Far Eastern International Bank in Taiwan.
The documents also show that it was holding approximately $2 billion in assets at two entities identified as ‘Gold Storage,’ nearly $400 million at Bradbury Investment Fund, $25 million at Metis GY Harvesting fund, and approximately $86 million at ‘GLL.’
The newly-released information also shows the secured lending that was an essential part of Tether’s operations during this period, pointing out that over $5 billion of its assets were in secured loans. It is also revealed that Tether accepted securities and ether as collateral alongside the previously-known bitcoin.
Bloomberg's coverage also highlighted that the only executives at Tether who are allowed to move funds from its reserve into the operating account are CFO Giancarlo Devasini and CIO Silvano Di Stefano. Tether had previously contended in its opposition to these FOI requests that releasing Silvano’s name would “constitute an unwarranted invasion of privacy.”
Di Stefano and Devasini were also both partners in BlueBit Capital Partners in Luxembourg, according to documents obtained by investigative journalist Nicola Borzi. BlueBit Capital Partners appears to have been a cryptocurrency investment and proprietary trading firm. While Devasini is not listed on the archived version of this website, the other partners, including Di Stefano are.
Tether’s reserves have been under intense scrutiny since the New York Attorney General revealed that Bitfinex had taken hundreds of millions of dollars from Tether in order to cover up inaccessible funds that were held at Crypto Capital Corp. Tether has characterized this court release of documents as evidence of its “ongoing and demonstrable commitment to transparency.”
The quality of assets backing USDT has long been the subject of scrutiny because of the crucial role it plays in crypto markets. Traders use the stablecoin, which has a circulation of about $83.5 billion, to move money into and out of cryptocurrency markets, swap funds between exchanges and as a haven in times of high volatility. Should Tether be unable to redeem the tokens for dollars, confidence in crypto assets would be shaken.
“Tether is in a completely different position compared to 2 years ago,” the company said in a blog post Friday. “It demonstrated, leading the industry during the biggest black swan events in 2020 and 2022, that its reserves are extremely liquid, of high quality and ready to be made available to support any size of redemption.”
In a bid for transparency, Tether released a quarterly so-called attestation report. Tether says on its website that it has yet to fail to redeem its stablecoin for dollars. But despite being carried out by an audit firm, an attestation is quite different from an audit, which involves uncovering data, risks, or compliance issues.
However, we do not believe that Tether is far from being an example of transparency and good practice. Its curriculum is what it is and it is far from being a monetary fund where its reserves ensure a 1:1 ratio with the dollar, but rather a hedge fund with practices that are far removed from conservative management. To date, the only thing that can be said is that: Tether can't audit anything, can't prove anything, can't verify anything. Last October Tether said that it has completely eliminated $30 billion commercial paper from reserves without any losses, certainly something very complex after the stresses suffered by fixed income during 2022.
Tether claims its stablecoin is backed one to one by the company’s reserves, for every Tether stablecoin there is a dollar, or cash equivalent, held by Tether, however, everything that has come to light does not seem to confirm this statement. We will be closely following everything surrounding the largest stablecoin in the crypto ecosystem, as it is surely the biggest risk facing the crypto market.
Cryptos: spot, derivatives and “on chain” metrics
Bitcoin rallied above $26,300 late Friday after the world's largest asset manager BlackRock filed for a bitcoin exchange-traded fund with the SEC diving as low as $24,789 Wednesday night, the first time falling below its $25,000 level since mid-March. This fall came as a response to the Federal Reserve’s decision to retain its existing interest rates. The Fed also predicted two more rate hikes in this cycle, coinciding with market expectations but resulting in a resumed sell-off in the crypto market which had been ongoing for the past three weeks.
Bitcoin traded between $26,000 and $27,500 for the past several weeks as it slumped over the month from its April 14th peak of $31,019, its highest level since last June.
Gainers / Losers last 7 days, block size volume

After the failure of the bearish imbalance of the upper value area marked in red the market tried to accumulate and reverse the bearish momentum, however the Vwap anchored at the highs has acted as severe resistance since these local highs generated in April. The market is in danger, losing the Vwap anchored at the impulse´s lows would open the door to look for the nearest lower volume node, the $23000 level.
Our bias remains neutral-bearish due to the aforementioned dynamics and we will rotate to full bearish in the short term with the loss of the aforementioned Vwap. The ball is in the bulls' court, if they want to turn this situation around they must conquer in a vigorous way and showing real strength the Vwap anchored at the local highs and the high volume node $28100. Realistically, the market's reaction to Blackrock's announcement has failed to conquer the levels we are asking of the bulls to break out of this short-term trend.
Bitcoin 12/06/23 30 min chart

Bitcoin 19/06/23 30 min chart

Moving further down the timeframe, to analyze the recent minor dynamics, we observe that the price has not been able to recover the Vpoc of the previous cumulative structure and is struggling with several Vwap anchored at relevant higher and lower highs. Any reversal of a trend takes time, that is why we will highlight to the reader the desirable dynamics for bulls, as well as the levels to conquer.
12/06/23

19/06/23

Moving up the timeframe is where we observe that a break and test in two legs of the upper red value area can actually materialize and this would have major implications on the lower core value area. We are still at a key moment. Bullish imbalance or failure of the main lower value area. An imbalance is desirable to always occur above the highs of the range, any deepening of the price to the lower value could seriously jeopardize any bullish approach.
It is in this timeframe as we clearly observe that the loss of the Vwap anchored at impulse´s low could open the door to the $23000 lower volume node. On the other side, and as we have said before, the conquest of the Vwap anchored at the local highs and the HVN of $28100 would open the door again to a clear long scenario.
Bitcoin 12/06/23 4h chart

Bitcoin 19/06/23 4h chart

Ethereum is dangerously deepening in the value area that we have been highlighting for weeks now. Demand must react in this area to prevent sellers from taking control again and even more so after rejecting the Vwap anchored at all time highs.
Ethereum 12/06/23 4h chart

Ethereum 19/06/23 4h chart

We will closely monitor the evolution of BNB as a measure of risk perception. BNB is the cryptocurrency coin that powers the BNB Chain ecosystem. BBN is one of the world's most popular utility tokens and it is used primarily to pay transaction and trading fees on the Binance exchange. It is Binance's flagship token.
At first glance we note that the Vwap anchored at highs has never been exceeded or practically tested since late 2021. The vigorousness with which the Vwap anchored at the local lows of June 2022 has been broken through makes us aware of the major weakness on this token. Clearly the area to watch is the historical support at $220, from there Binance could be in serious trouble. There has not been a strong market reaction after testing this level last week, as long as the market continues to hover in this zone, the danger is on the table.
BNB 12/06/23 4h chart

BNB 19/06/23 4h chart

On-chain metrics
Volatility, volumes, and realized values are at multi-year lows, indicating that Bitcoin investor apathy is firmly in play. However, under the surface, Hodlers continue their classic slow and steady accumulation, with the halving now less than 1yr away.

BTC and ETH's 90D volatility is at multi-year lows, closely matching the trend in trade volume.

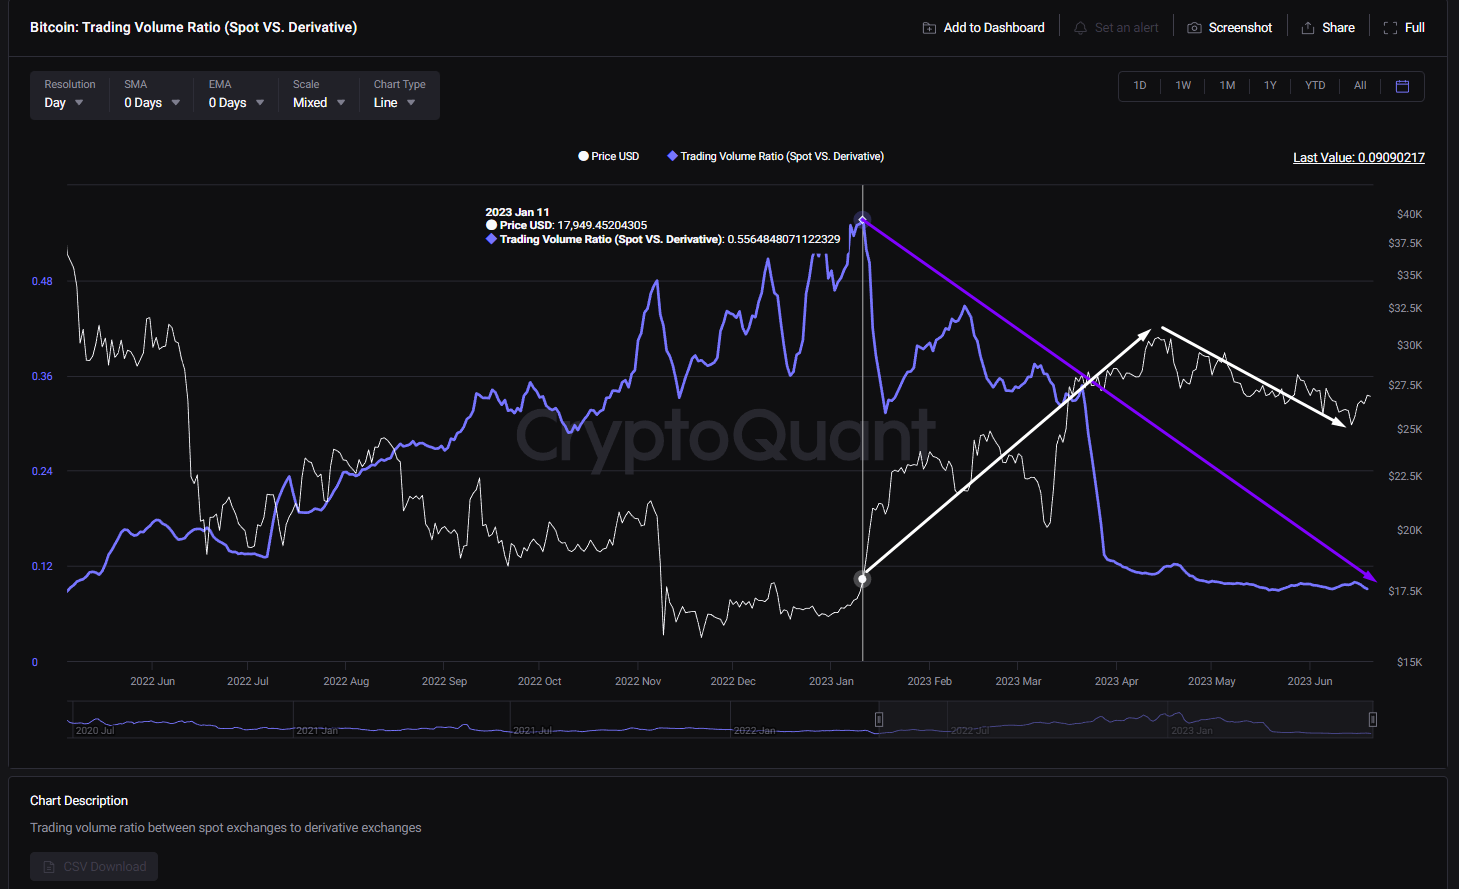
Looking at this Cryptoquant chart we continue to see a dominance of derivatives in the market. It does not appear that organic spot buys have been leading the market dynamics since the beginning of the year.
Digital asset investment products saw minor outflows totalling $5.1m. The end of the week saw minor inflows following the news that one of the world’s largest asset managers has applied for Bitcoin ETF in the US.

Bitcoin Miners to Exchange Flow (7d MA) just reached a 5-year high of 75.566 BTC.


Classic markets
The S&P 500 Index notched its longest stretch of daily gains since November 2021 and its best weekly performance since the end of March. Markets largely took the prospects of additional rate hikes in stride, posting a strong gain last week, a notable portion of which came after the Fed's announcement. We think the market's reaction reflects an interpretation that the Fed may not need to make good on its projections for multiple additional rate hikes, and that even if it does, the end of the hiking cycle is within sight.
The S&P 500 is up more than 7% just in the last month, powered by leadership from the mega-cap technology cohort, as reflected in the 11% gain in the Nasdaq over the last month and it is better than 30% gain so far this year.
Approaching the end of the first half of the year hasn't yielded much economic clarity. There remains a relatively strong bifurcation between certain segments of the economy, be it manufacturing (weaker) and services (resilient), or leading economic indicators (weaker) and their coincident peers (resilient), which has mostly been reflected in the stock market.
The split between leading and coincident data has garnered a lot of attention due to the significant deterioration in leading economic indicators over the past year. As shown in the chart below, The Conference Board's Leading Economic Index (LEI) has contracted for 13 consecutive months. Only twice in history have we seen longer streaks: the recessions that started in 1973 and 2007.

On the surface, the recessionary-like signal from leading indicators seems to be at odds with a stock market (as reflected by the S&P 500 index) that continues to propel higher. Yet, a look underneath the surface reveals that the market's internals are somewhat reflective of concerns over the trajectory of the economy. The Russell 2000 (a proxy for small caps and increasingly linked to economic growth) has underperformed the Nasdaq 100 (which tracks large-cap, tech-oriented stocks) considerably this year. As has been well-advertised at this point, the bifurcation between strong performance among large caps and very little (if any) participation among small caps has cast doubt on the market's rally this year.

As shown in the chart below, the percentage of bulls in the American Association of Individual Investors (AAII) survey jumped in early June to its highest since November 2021 (the magnitude of the jump was the strongest since November 2020).


Whether from the mini-mania over artificial intelligence, hopes for a soft landing in the economy, or expectations for the Fed to fully let off the brake, that sentiment is showing up in areas such as valuations, where the forward price-to-earnings ratio on the S&P 500 has risen markedly. The possibility of downward revisions to corporate earnings estimates, along with further changes in expectations of upcoming Federal Reserve actions, could be important catalysts for selling pressure in the market, a market that seems to want to get ahead of itself well ahead of the generally discounted future reality.


We still believe market earnings expectations are too optimistic. Despite the AI 'hype' Tech stocks are cyclical as are their sales and earnings. This great chart shows how Tech sales are slowing relative to costs.


Whether or not this is the start of a bull market, the market appears to be overcrowded on the long side. The market is undoubtedly in "greed mode" considering the following metrics:
Retail just bought the most stocks since the second half of 2021, according to BofA. According to Vanda, retail bought the most $AAPL since Dec 2021 recently. Are we feeling a bit stretched in positioning and flows?


AAPL is now worth more than the entire Russell 2000 combined!

US equity funds and ETFs once again saw strong weekly inflows.

SPY call volume at all time highs

Last week we did not propose scenarios, as we were facing the big week, US CPI, FED, ECB and OPEX. Having weathered the storm of macro events and with 40% of the gamma released in this expiration, the market is now where to show its intentions for this summer period. It is not an easy task to propose scenarios in this context of verticality and panic buying and as always we resort to analyzing the gamma profile of the market, especially after Friday's expiration.
After last week's climatic event we are looking for retracements to the lower part of the Gamma Call Wall, specifically to the 4375 point area. Once there, we will assess the strength of demand and ability to establish this level as support. If so, and observing a bullish market gamma profile after OPEX, a test to the 4500 area, we see it as perfectly feasible. Losing the 4375 level could open the door to further corrections up to the zero gamma level, the market's turning point.
12/06/23 SP500 futures big picture

19/06/23 SP500 futures big picture

Gamma Profile 12/06/22

Gamma Profile 19/06/22

Looking at a larger time frame chart, where we can observe the big picture, we can clearly see that the market achieved a great feat, consolidating above the Vwap anchored at all time highs and the main Vpoc of the composite. However, the subsequent movement after that feat shows climatic characteristics, where the price has been parabolically looking for the second higher standard deviation of the Vwap anchored at highs and already testing the third standard deviation of the Vwap anchored at local lows. All this has been done without any rest and dragging extreme metrics such as those mentioned above. A pullback seems to be inevitable and even healthy, in order to eliminate over-positioning and fomo. Markets do not rise vertically and relentlessly, especially not in such an excited way and led by price agnostic flows and strong leverage via options.
Bulls can certainly breathe easy as long as the market is above the Vwap anchored at highs and the headline VPOC.


