.png)


.png)
Summary
Positive growth and inflation surprises helped the major benchmarks round out a solid quarter on a high note, with the S&P 500 Index recording its best weekly gain since the end of March. The major U.S. stock indexes regained the ground they had lost the previous week. The technology-heavy Nasdaq Composite remained well ahead of the other benchmarks for the year-to-date, however, ending the week with a six-month gain of nearly 32%, its best start to the year since 1983.
Apple closed trading Friday with a market capitalization above USD 3 trillion. The Wall Street Journal reported that Apple’s valuation has surpassed that of five of the S&P 500’s 11 sectors in their entirety (materials, real estate, utilities, energy, and consumer staples). However, over the weekend Apple reported that it is cutting its production forecasts for Vision Pro headsets.
The July 4 holiday in the United States may well bring a quiet start to the week for world markets. But don't bet on it. China and Japan are worried about currency weakness, meaning investors are alert for signs of action from authorities. Australia's central bank meets and the most closely-watched U.S. economic indicator is out Friday. Investors betting on resiliency of the U.S. economy have found solace in the solid labor market. But its strength will be tested by the July 7 monthly jobs report.
One catalyst for a volatility rebound could be second-quarter earnings season, which begins in mid-July. Many stocks are up a lot going into their coming reports. There’s potential for a sell-the-news earnings season should management teams remain cautious or results disappoint. The Cboe Volatility Index (VIX) has been bouncing around near 13, a level not seen since before the Covid-19 pandemic. If the VIX, known as the market’s fear gauge, is to be believed, investors are as frightened as a mouse in a cheese factory while the cat’s on vacation.
Cryptocurrencies hardly had any relevant movements during the week but had a tough end last week, as the Securities and Exchange Commission said that current bitcoin ETF filings were “inadequate,” sending prices down. The SEC reportedly considered the BTC spot ETF applications lacking clarity and comprehensiveness around surveillance-sharing agreements or appropriate details about the surveillance-sharing agreements. Some of the issuers have re-filed, naming Coinbase as their market surveillance partner.
Macro and news

U.S Macro data
Inflation data released Friday appeared to provide the biggest boost to sentiment. The Commerce Department reported that its personal consumption expenditures (PCE) price index had increased by 0.1% in May, bringing its year-over-year increase down to 3.8%, its lowest level since April 2021. The core (excluding food and energy) PCE index, considered the Federal Reserve’s preferred inflation gauge, fell back to 4.6% on a year-over-year basis, still well above the Fed’s 2% target, but seemingly calmed fears of a reacceleration in price pressures after April’s upside surprise.

A revised estimate of the U.S. economy’s growth in this year’s first quarter showed a markedly stronger result than an earlier report. Gross domestic product increased at a 2.0% annualized pace, up from the previous estimate of 1.3%, largely because consumer spending and exports were stronger than estimated previously.
The health of the economy has benefitted from a strength in household services and discretionary spending, with the resiliency of the consumer directly traced to the strength of the labor market, which remained on display in the first half of the year. We think both employment and spending growth will soften in the back half of the year, and while we don't think personal consumption will fully reverse course, we do think it will slow sufficiently to see GDP weaken in the quarters ahead.


Weekly jobless claims defied expectations and plummeted by 26,000 from a 20-month high to 239,000, marking the sharpest drop since October 2021. Continuing claims also surprised on the downside and fell back to a four-month low.

May new home sales easily outpaced estimates, rising 12.2% in May, well above expectations for a modest decline and at the fastest pace since February 2022, when rates for a fixed 30-year mortgage were nearly 300 basis points (three percentage points) lower.

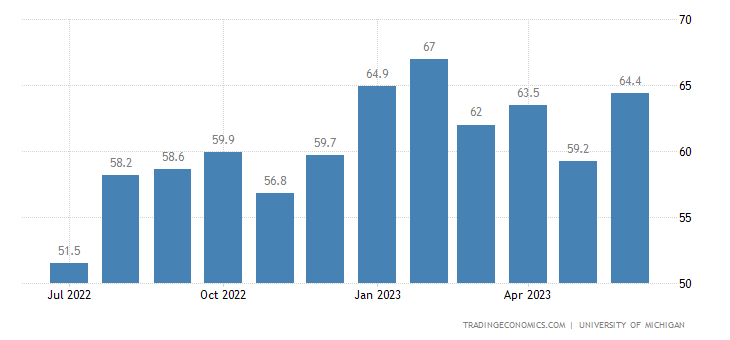
The University of Michigan consumer sentiment for the US was revised higher to 64.4 in June of 2023, the highest in four months, from a preliminary of 63.9. Improvements were also seen in both current economic conditions (69 vs 68) and consumer expectations (61.5 vs 61.3). "Overall, this striking upswing reflects a recovery in attitudes generated by the early-month resolution of the debt ceiling crisis, along with more positive feelings over softening inflation.
Yields of U.S. government bonds rose, ending what had been a mostly quiet stretch for fixed income in June. The yield of the 10-year U.S. Treasury bond closed at 3.81% on Friday, up from 3.74% at the end of the previous week. As recently as early April, the yield had been as low as 3.29%. Shorter-term rates have been slightly more buoyant lately as economic data has surprised to the upside and the Fed has signaled it may squeeze in one or two more rate hikes.

Markets expect the FederalReserve Target Rate to be 3.81% in December 2024.

Eurozone macro data
Annual inflation in the eurozone slowed for a third month in June to 5.5% from 6.1% in May, according to an initial estimate from the European Union’s statistics office. Core inflation, which excludes energy, food, alcohol, and tobacco prices, ticked up to 5.4% from 5.3%.


News reports from the ECB’s annual Forum on Central Banking suggested that policymakers are still likely to vote for another interest rate increase in July. ECB President Christine Lagarde acknowledged that the central bank had made “significant progress” in combating high inflation but asserted that policymakers “cannot declare victory yet. Ecb's de guindos said that the July rate hike is set and Ecb officials weigh faster reduction of bond portfolio.
Germany where deflationary pressures keep rising. Import prices were 9.1% lower in May YoY, the biggest drop since September 2009. Main reason for decline was the base effect from the high price level in previous years due to the war in Ukraine. Energy imports were 37.6% cheaper YoY.

German real retail sales YoY actual -3.6% (forecast -4.9%, previous -4.3%). Despite the beat above, German retail sales is still rather subdued when you look into the details. In real terms, retail sales are still down 3.6% compared to the same period last year as opposed to the nominal reading, which shows a 2.8% increase.
IFO German business climate index fell more sharply than expected to 88.5 vs 90.7 expected. The outlook component in particular plunged to 83.6 in June from 88.3 in May vs 88.1 expected and the lowest level since 2022.

Spanish CPI EU Harmonised (Y/Y) Jun P: 1.6% (est 1.5%; prev 2.9%)
Spanish CPI (Y/Y) Jun P: 1.9% (est 1.7%; prev 3.2%)
Spanish CPI EU Harmonised (M/M) Jun P: 0.6% (est 0.4%; prev -0.1%)
Spanish CPI (M/M) Jun P: 0.6% (est 0.3%; prev 0.0%)
UK macro data
Bank of England (BoE) Governor Andrew Bailey said at the ECB’s annual Forum on Central Banking that UK interest rates are likely to stay higher for longer than financial markets expect. Derivative instruments indicate borrowing costs could rise from 5% now to 6.5% by the end of the year, before falling in late spring of 2024.
UK GDP QoQ actual 0.1% (forecast 0.1%, previous 0.1%)
UK GDP YoY actual 0.2% (forecast 0.2%, previous 0.2%)

Japan macro data
Japan’s monetary authorities stated that every option is on the table to cope with excess volatility in the foreign exchange markets, as the Japanese currency fell to near a seven-month low of around JPY 144.8 against the U.S. dollar. It briefly hit the JPY 145 level that had prompted the Bank of Japan (BoJ) to undertake a yen-buying intervention in September 2022, leading to investor anticipation that the central bank would again step in.
China macro data
China’s official manufacturing Purchasing Managers’ Index (PMI) ticked up to 49.0 in June, in line with expectations and an improvement from the 48.8 registered in May. Nevertheless, PMI readings less than 50 indicate a contraction in activity.

Profits at China’s industrial firms fell 18.8% year over year in the first five months of 2023, according to the National Bureau of Statistics. This contraction was less than the 20.6% decline recorded this year through the end of April.
China likely to ramp up monetary, fiscal stimulus, survey shows - bloomberg
The great reopening that wasn’t? China’s stock market is looking increasingly precarious as the primary pillars of its economy, real estate and construction, are not growing.

Crypto News
=> The Coinbase cryptocurrency exchange has fought back against the U.S. Securities and Exchange Commission (SEC) by filing a motion to dismiss a lawsuit against it. The company argues that the agency’s claims contradict previous agreements.
The SEC has maintained that certain digital assets on the exchange platform are securities. However, Coinbase counters the claims that the assets in question are not securities, and the transactions are not securities transactions. They also assert that the SEC has no jurisdiction over the cryptocurrencies on their platform while believing that the lawsuit should be dismissed as it goes beyond existing law.
=> The relaunch of the collapsed exchange, FTX, and its worldwide subsidiary, Ftx.com, is now a possibility, according to CEO John J. Ray III, who stated that management is pushing forward with plans for the company's rebirth. The relaunch will very indeed be rebranded to remove the poisonous FTX name, and it will be a collaborative venture. According to the Wall Street Journal (WSJ), the management is also planning to pay existing customers, who may be offered interest in the relaunched platform.
=> The head of the SEC, Gary Gensler, faced criticism the day after the Blockchain Association released a document suggesting that Gensler should refrain from making decisions concerning the enforcement of digital assets. According to the paper, the Securities and Exchange Commission (SEC) has neglected its role as a regulatory body in the digital asset realm, leaving crucial issues unresolved, particularly the determination of whether a digital asset qualifies as a "security." The paper highlighted Gensler's expressed belief that all digital assets, except for Bitcoin (BTC), are unregistered securities, and that digital asset trading platforms are unregistered securities exchanges.
=> UK passes bill to recognize crypto as regulated financial activity. The UK crypto industry received another boost on Thursday as the Financial Services and Markets Act 2023 became the law of the land. The act, a milestone in the UK’s independent financial rulemaking after leaving the European Union, promotes the regulation of crypto assets in support of their wider adoption.
Under the new regime, cryptoassets such as stablecoins will be under the official jurisdiction of the country’s financial regulators. It also establishes “sandboxes” to enable the safe adoption of emerging technologies like blockchain in financial markets.
=> The U.S. Securities and Exchange Commission has said that the wave of spot Bitcoin exchange-traded funds (ETFs) applications filed this month are inadequate. The SEC doesn't think the Bitcoin ETF applicants have been specific enough about how they'll manage a "surveillance-sharing agreement." The agreement is meant to deter fraud and manipulation by ensuring the fund issuer is monitoring market trading activity, clearing activity and customer identity. So far, the SEC has said that all Bitcoin ETF applications have fallen short in this regard.
=> On June 20, crypto exchange EDX Markets officially launched its platform, supporting trading of Bitcoin, Ethereum, Litecoin (LTC) and Bitcoin Cash. EDX Markets is backed by a consortium of financial giants, including Charles Schwab, Fidelity Digital Assets and Citadel Securities. EDX also announced it has closed a second funding round that includes investments by Miami International Holdings, DV Crypto, GTS, GSR Markets LTD and HRT Technology.
EDX appears to be taking steps to avoid the wrath of the SEC and other crypto regulators. Unlike Coinbase, Binance and failed crypto exchange FTX, EDX plans to operate as a non-custodial exchange, meaning the exchange won’t hold customers’ crypto assets during trading. In addition, none of the four cryptos initially available to trade on EDX Markets have been classified as securities by the SEC.
=> PolyNetwork has allegedly been hacked again, according to PeckShield Inc., an on-chain data analytics and security company. The hackers appear to have made several transactions in huge assets on several chains.
The recent hack isn’t the first time the PolyNetwork has been attacked. Earlier, in August 2021, PolyNetwork had a major hack where the platform lost more than $600 million. The hack was named the greatest DeFi hack of all time. According to reports, the hack resulted from mismanaged access rights between two major Poly smart contracts, the EthCrossChainManager and EthCrossChainData.
Cryptos: spot, derivatives and “on chain” metrics
The renewed institutional interest in crypto sent Bitcoin surging to new 52-week highs above $31,300 in June, but Bitcoin pared back some of its gains in the closing week of the month. This week has had mild market activity for cryptocurrencies, with many only recording mild gains as a notable few rallied. Bitcoin has had a relatively slow week recording a drop of only 0.3% for the seven days as the asset now trades back above the $30000 mark. However, Bitcoin Cash (BCH) has dominated this week’s session as the asset now boasts a 50% weekly gain as it trades at $301. Ethereum has also made no positive progress over the week, as its weekly drop stands at 0.17%.
The total market capitalization of the global cryptocurrency market peaked at over $2.9 trillion in November 2021 but took a big hit during crypto winter in 2022. That market cap now stands at just $1.1 trillion heading into the second half of 2023.
Gainers / Losers last 7 days, block size volume.

The market has managed to break the Vwap anchored at the local highs and the High volume node at $28100. Now remains the next big step, the consolidation of this battle won by the bulls. It seems that during the past week we have witnessed this process of consolidation of gains and breaks of relevant levels on the demand side.
As we said last week, as long as the price remains above the high volume node of $28100 and the Vwap anchored to the previous local highs, the long scenario should be maintained.
Bitcoin 26/06/23 30 min chart

Bitcoin 03/07/23 30 min chart

Moving up the timeframe, the scenario of effective bullish imbalance of the entire lower value area gains strength. The verticality of the rise leaving a somewhat inefficient auction and the clash with the third typical deviation of the main Wwap are the only impediments to further upside for the time being.
As we have said before, the conquest of the Vwap anchored at the previous local highs and the HVN of $28,100 would open the door again to a clear medium-long term long scenario.
Bitcoin 26/06/23 4h chart

Bitcoin 03/07/23 4h chart

The metrics “on chain” and specifically on derivatives show us the classic profit taking. The taker buy/sell ratio shows strong selling pressure after the equilibrium reached by the price after the big spike two weeks ago. It is worth noting that despite this selling pressure, the market has managed to remain in equilibrium above the $30000 level. All this is confirmed by the fall of the open interest, probably due to the closing of longs and the fall of the estimated leverage ratio. As we said last week, a bull market can start led by derivatives, but it is now where the organic demand for spot has to take a relevant role and start leading the movements.


"Fund holdings" refer to the cryptocurrency holdings of institutional investors, including hedge funds, investment firms, and cryptocurrency private funds. Analyzing the holdings of these funds provides valuable insights into the market dynamics and investor sentiment. By closely observing fund holdings, we can identify a significant upward trend in the accumulation of bitcoins by these institutional entities. This exponential increase in holdings indicates a strong interest to acquire Bitcoin, even at its current price level.
Seems that cryptocurrencies are gaining recognition as a legit investment option, with heavyweight institutional investors joining the fray. The more this happens, the more market stability we can expect, leading to fewer of those wild price swings.

Largest decline of Bitcoin inflows and supply in history. Bitcoin currently reflects an 80% decline over 612 days (and counting) in the number of addresses logging inflows (inferred selling) is a record. That is measuring from October 2021, but if measuring from the May 2021 top, the decline in addresses rises to 84%. This suggests an enduring and positive evolution in the general perception of Bitcoin, especially when coupled with BlackRock and other ETFs recently filed/re-filed, and some of the upcoming regulatory frameworks being introduced among leading markets, particularly the G20.

The Bitcoin Composite Index (BCI) is designed to help investors identify the peaks and bottoms of Bitcoin market cycles. The index uses two key metrics, NUPL and MVRV, which are smoothed with a moving average and displayed on a chart as an oscillator.

In previous analyses we commented that: “Demand must react in this area to prevent sellers from taking control again and even more so after rejecting the Vwap anchored at all time highs”. The reaction has been in the expected area, the bulls have reacted, however, in order to propose an analysis with a solid long approach, we continue to insist that the market must consolidate and conquer the Vwap anchored at all time highs. The price dynamics are progressing well enough to continue thinking in a bullish scenario.
Ethereum 26/06/23 4h chart

Ethereum 03/07/23 4h chart

We will closely monitor the evolution of BNB as a measure of risk perception. BNB is the cryptocurrency coin that powers the BNB Chain ecosystem. BNB is one of the world's most popular utility tokens and it is used primarily to pay transaction and trading fees on the Binance exchange. It is Binance's flagship token.
At first glance we note that the Vwap anchored at highs has never been exceeded or practically tested since late 2021. The vigorousness with which the Vwap anchored at the local lows of June 2022 has been broken through makes us aware of the major weakness on this token. Clearly the area to watch is the historical support at $220, from there Binance could be in serious trouble. During the last week, despite being very close to the loss of this important level, the market has been holding up well.
BNB 26/06/23 4h chart

BNB 03/07/23 4h chart

Classic markets

Not only has technology outperformance led the broader indexes higher, but the leadership within the sector has been concentrated in a few of the mega-cap names. Apple (whose market cap reached $3 trillion last week), Microsoft, Tesla, Amazon, Alphabet (Google), NVIDIA, and Meta gained an average of roughly 85% in the first six months of this year. This means the breadth of the market's gains has been fairly narrow, as demonstrated by the 15% year-to-date gain in the SP 500, compared to a 6% gain in the equal-weighted SP 500 index (which eliminates the influence of company size). This is not necessarily a harbinger of bad news for equities, but it does make the market potentially more vulnerable to a short-term pullback if mega-cap tech were to stumble.

Meta, Amazon, Apple, Microsoft, Google, Tesla, and Nvidia had risen 53% since December '22, while the remaining 493 companies had flatlined with 0% total return in the same timeframe. The seven companies mentioned above constitute 27.65% of the SP 500, boasting a combined market cap of slightly above $10 trillion. This matches the combined GDP of Japan, Germany, and South Korea, nations with a total population of around 260 million.

Assuming October was the low: on an equal-weighted basis, the S&P 500 is up only 14%, would be the weakest recovery on record.


The top 2 stocks in the SP 500 (Apple & Microsoft) now represent a combined 14.4% of the index, the highest weighting for any two companies with data going back to 1980.

Small-cap equities, which are often more sensitive to domestic economic conditions compared to large-cap companies, have leveled off relative to large-caps following underperformance earlier this year. We have not yet seen a decisive upturn in relative performance from small-caps that would be more indicative of an economic bottoming and new emerging expansion.


One of the more remarkable dynamics this past month has been the absolute collapse of correlation between the Nasdaq and the R2000. This can be seen in the slope coefficient (beta) of the R2000 vs the NDX, which has fallen consistently over the past thirty years, but dropped to a near record low 0.24x in the last month. All of the gains in the R2000 have been idiosyncratic and largely uncorrelated to the Nasdaq in the last month.

While plenty of uncertainty around the economic and monetary policy outlooks remain, market swings have been rather benign for much of 2023, save for the short-but-sharp reaction to the bank turmoil. The VIX index, a measure of market volatility, has declined fairly steadily since it fell to its lowest level since the bank episode in March, including reaching its lowest level last week since before the pandemic.

Volatility may be set to rise in the years ahead, as a peak in rates tends to have a two-year lag with the VIX.

The divergence of equity and bond market volatility is highly unusual, now the big question is, who will go in search of whom?

Equity risk premium remains at the lowest levels in over two decades. It makes a lot more sense to consider short duration fixed income in this environment than to have a lot of risk on in stocks.


DAX vs Euro area PMI Manufacturing, it shows a greater divergence than before the 2020 pandemic.

The systematic positioning of “price agnostic” flows has been the main source of demand since the beginning of the year. These flows do not understand macro or fundamentals but are basically based on trends and volatility parameters, in fact, and according to the following graph, they show a significant divergence with respect to the ISM manufacturing. However, CTAs have little left to buy on a positively trending market, but with a momentum shift lower they will have between $10B and $70B worth of exposure to sell.


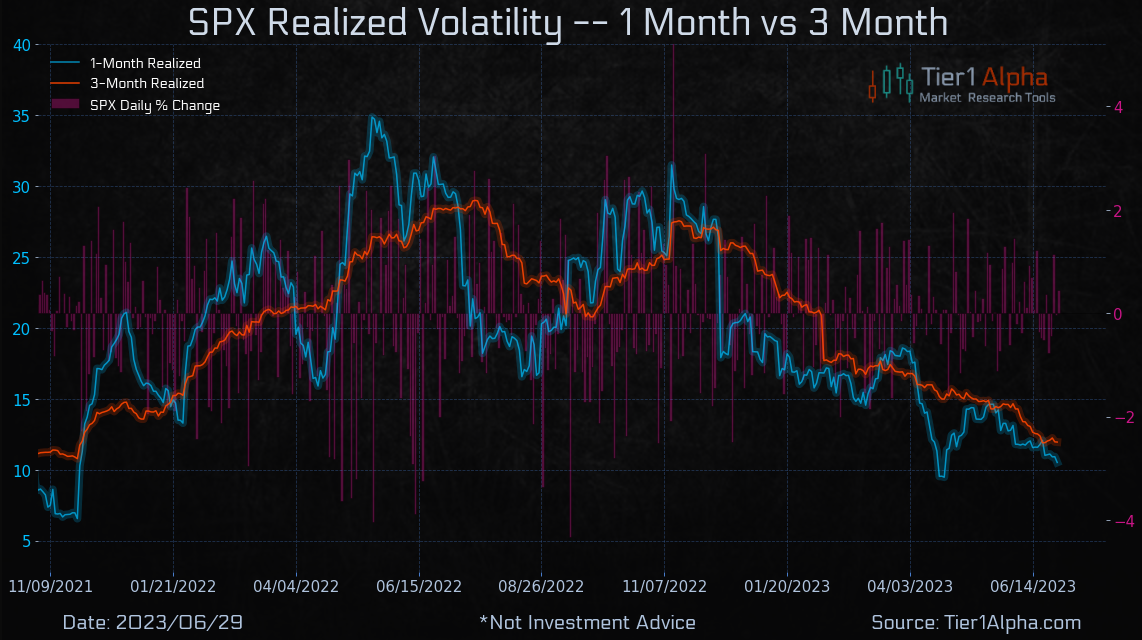
The goal of a vol control fund is to maintain a consistent level of volatility within a portfolio by dynamically rebalancing between risk assets and cash. As realized volatility rises, the funds have to mechanically sell stocks, and when it falls, these funds will buy stocks. More often than not, these funds use a strategy called volatility scaling, which, broadly speaking, uses the higher of either the 1-month or 3-month realized volatility as a toggle for their risk exposure. Right now, the 3-month volatility is higher at 11.95, which means it is the main input these funds are using.

Hedge fund gross leverage is at a historic extreme at 258%, a five-year high. This increases tail risk as we could have situations where if markets move against these funds they have to unwind one or both sides of their books. Sometimes in a hurry. Which can both push share prices up and down depending on whether they are covering shorts or selling longs.

We do see liquidity from central banks beginning to roll off, and that correlation with markets suggests that it may be a headwind moving forward. Particularly with Treasury issuance pulling more liquidity out of the market. SPY divergence with liquidity speaks for itself.

The relationship between the BTGP rate and the SP 500 seems to indicate that markets remain liquidity junkies.

Last week we commented the following: “..The key of the week will be to observe if the market is able to recover this zone of interest or if it experiences rejection when testing it. We have the gamma flip very close (4342.5), a rejection to the zone mentioned above and a break of the zero gamma level could trigger significant selling. However, we do not expect the market to deepen beyond 4320 until the JP Morgan collar trade expires on June 30..”,
Last week the market was able to recover the commented zone after finding demand at the zero gamma level. In turn the market has been able to rotate the gamma stack to slightly higher levels. This week we will again remain on the sidelines of the market. Despite the insistence to continue rising, we define the moment as climatic and even more so in view of the closing of trimesters and semester where many rebalancing and make-up movements take place.
Certainly we see the upward movement as very exhausted, for all that has been exposed in this newsletter, and we believe that there is little to gain and much to lose on the upside. We will closely follow the zero gamma level (inflection point) which now stands at 4357.5 points for the SPX, as it is the clear turning point of the market and where volatility may kick in.
26/06/23 SP500 futures big picture

03/07/23 SP500 futures big picture

We again see a Skew-adjusted gamma exposure at climactic levels and a prominent gamma call wall at 4500. All this should act as resistance for further rallies this week.
Gamma Profile 26/06/23

Gamma Profile 03/07/23

The market is still completely dominated by the flow of ultra-short-term options, which is undoubtedly a risk in itself. Many times nothing catastrophic needs to happen, but rather the market sets itself up for something catastrophic to occur. We are certainly at this point in time.


