.png)


.png)
Summary
With earnings season well under way, the SP500 posted their second weekly gains in a row while the Nasdaq finished slightly lower. Through Friday, and the second week of earnings season, the proportion of SP500 companies that had beaten analysts’ quarterly net income expectations stood at 75%, according to FactSet.
Earnings season also enters one of its busiest weeks with big tech companies Microsoft, Meta Platforms, and Google parent Alphabet set to report, along with Visa, Mastercard, Texas Instruments, Coca Cola Company, McDonald’s, Boeing, AT&T, Verizon, Ford Motor Company, Chevron, and ExxonMobil, among others. The advance estimate for second-quarter gross domestic product (GDP) will be released on Thursday, followed by the Personal Consumption Expenditures (PCE) Price Index,the Fed’s preferred inflation gauge,on Friday.
After moving sharply higher and then lower in the first half of July, government bond yields held steady in the latest week as investors looked ahead to a U.S. Federal Reserve meeting that concludes on Wednesday. The Fed was widely expected to lift its key benchmark rate by a quarter percentage point after pausing its rate hiking cycle at its June meeting. Many investors are anticipating the Fed will be “one and done” after its policy meeting in the week ahead, but a surprise move by the central bank or any hawkish commentary from Fed Chair Jerome Powell could potentially throw cold water on recent investor enthusiasm.
China reported that its economy expanded at an annual rate of 6.3% in this year’s second quarter. The result was well below most economists’ forecasts and another sign that China’s post pandemic economic rebound has so far fallen short of expectations.
Bitcoin has been trading in a ranging market for the past three weeks. The world’s largest cryptocurrency by market cap has been stuck between the $29,500 and $31,800 levels over the last month, indicating a ranging market. There hasn’t been a massive upward or downward movement since Bitcoin experienced a rally from $25,000 to the sub $30,000 region last month. There is no major catalyst behind the ETF and Ripple effect to push the market higher at this time, investors could be waiting for the latest interest rates decision from the United States Federal Reserve to determine the market’s direction.
Macro y news

Earnings for this coming week:

U.S Macro data
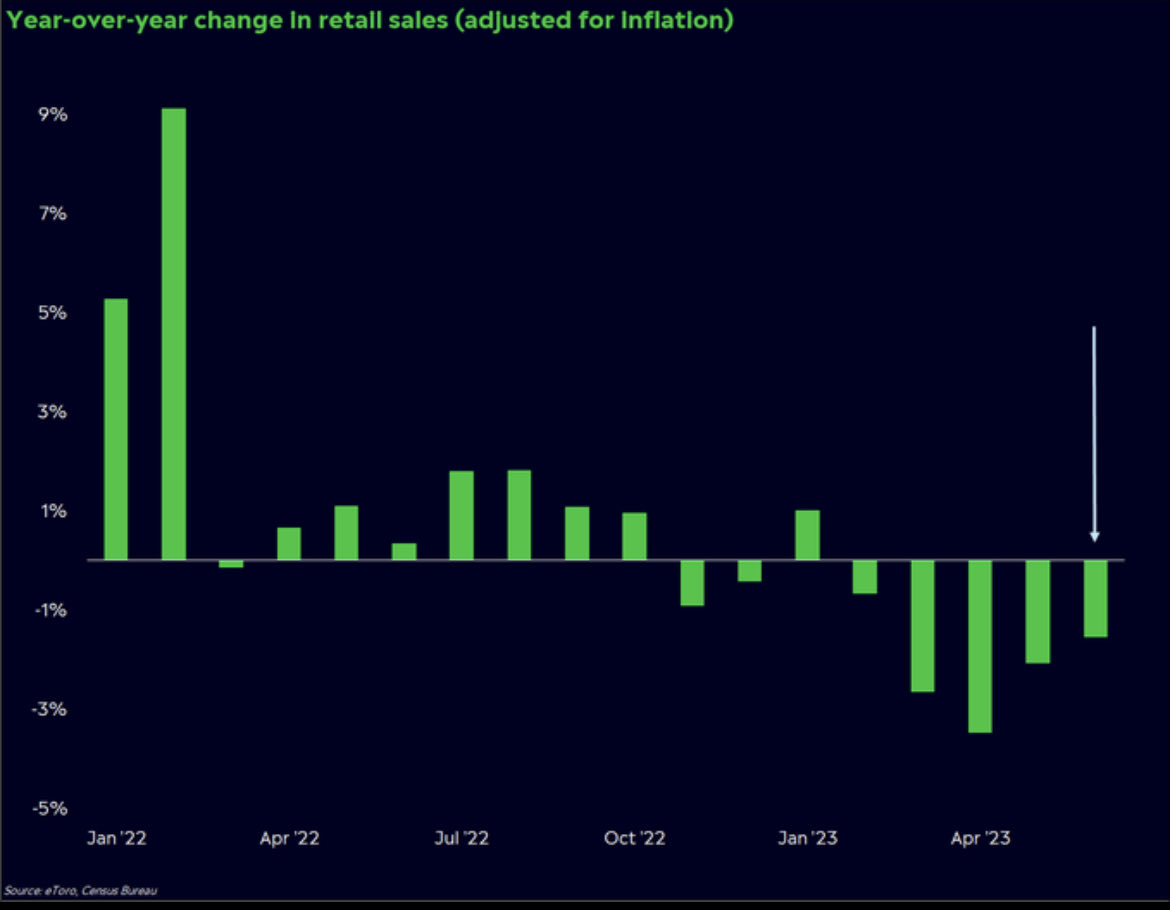
Retail sales ticked up 0.2% sequentially in June, a slower pace than the 0.6% consensus estimate reported by FactSet. Upward revisions to the May data raised the growth rate for that month to 0.5% from the initial reading of 0.3%

Retail Sales (Inflation adjusted) have had annual basis declines in 7 of the last 8 month, including 5 straight.
The number of Americans filing new claims for unemployment benefits unexpectedly fell last week, touching the lowest level in two months amid ongoing labor market tightness and defying efforts by the Federal Reserve to slow demand.

While the labor market remains in great shape by historical standards, there are early signals that some softness is emerging. Initial jobless claims are a credible leading indicator. While not heralding a collapse in employment, the three-week moving average in weekly initial jobless claims is up nearly 20% over the last six months.
Trends in jobless claims, labor turnover and hourly earnings are signaling some emerging fatigue that will transpire in the second half of the year. We expect a modest lift in the unemployment rate, accompanied by slower monthly job and wage gains, culminating in slower consumer spending ahead, which will ultimately take some of the wind out of the sails of GDP growth.
The Conference Board’s Leading Economic Index (LEI), a forward-looking gauge of U.S. economic activity, decreased for a 15th consecutive month in June, the longest string of sequential declines since 2007–2008. The decrease appeared to stem from weakness in consumer sentiment and new orders as well as a slowdown in housing construction.

Eurozone macro data
The eurozone economy avoided a recession in the first quarter of this year, with revised figures showing it remained unchanged instead of contracting as previously estimated. Gross domestic product was flat in the first three months of the year, up from a prior estimate of a 0.1% contraction.

UK macro data
UK annual consumer price growth slowed to 7.9% in June from 8.7% in May due to a decline in gasoline prices. The magnitude of the slowdown in inflation exceeded a consensus estimate and matched the Bank of England’s (BoE) forecast.
UK June core cpi rises 6.9% y/y; est. +7.1%
UK June cpih rises 7.3% y/y; est. +7.5%
UK June consumer prices rise 7.9% y/y; est. +8.2%
UK June consumer prices rise 0.1% m/m; est. +0.4%


UK investors shun bets for 50 bps rate hike from BOE in aug, now see around 65% chance of 25 bps hike in August (tuesday: 58% chance of 50 bps). Uk investors no longer fully price in peak bank rate of 6%, OIS curve now points to peak of between 5.75% and 6% in late 2023/early 2024.
Japan macro data
Japan’s stock markets registered flat performance for the week, sentiment was largely driven by investor caution ahead of the Bank of Japan’s (BoJ’s) July 27–28 monetary policy meeting and a slight dampening in expectations that the central bank would tweak its yield curve control (YCC) framework. However, a hot June core consumer price inflation print, in line with consensus expectations, exerted some pressure on the BoJ to tighten policy and to raise its inflation forecasts.
Inflation remains well above the BoJ’s 2% target, in June, Japan’s core consumer price index rose 3.3% year on year, in line with expectations and a slight uptick from the prior month’s 3.2% increase.

Comments by BoJ Governor Kazuo Ueda, as reported by the Reuters news agency, dampened expectations that the central bank might take steps to normalize monetary policy after a period of prolonged stimulus. Ueda said that there was still some distance to achieving the central bank’s 2% inflation target in a sustainable fashion. Having patiently continued ultra-loose monetary policy under YCC, the BoJ will scrutinize at each policy meeting the progress made in achieving its inflation target.
China macro data
On a year-over-year basis, China’s gross domestic product expanded 6.3% in the second quarter, below expectations but faster than the 4.5% growth rate recorded in the first quarter. On a quarterly basis, the economy grew 0.8%, down from the first quarter’s 2.2% expansion. Unemployment remained steady at 5.2% in June, but youth unemployment jumped to a record 21.3%.


The government pledged to improve conditions for private businesses to boost corporate confidence amid the faltering recovery, according to a statement released Wednesday. Separately, Chinese authorities unveiled an 11-point consumption plan to boost household spending.
China imports record volumes of Russian oil in the first half of 2023.

China junk bonds suffer the worst slide of 2023 as defaults mount.

Asia macro data
Taiwan's chip exports just fell the most in 14 years, down 20.8%. This was the sixth consecutive month of falling exports on slowing demand. Shipments to mainland China and Hong Kong, which account for over 50% of Taiwan's chip exports, fell for an eighth month.

Bonus macro data: Financial conditions and credit are worsening in the U.S.
The Fed is stepping hard on the brakes, and the lagged effects of Fed hikes and rates staying higher for longer will weigh on nonfarm payrolls, capex spending, and consumer spending over the coming 12 to 18 months, which would cause a recession.
Looking at a broad range of leading indicators, including rising delinquency rates for credit cards and auto loans, rising default rates for HY and loans, rising weekly bankruptcies, slowing weekly loan growth for banks, and leading indicators for jobless claims (see charts below), we continue to see the recession narrative as the most likely outcome. Rising rates have already had a negative impact on more leveraged consumers, firms, and commercial real estate. And with the Fed on hold for “a couple of years,” the negative effects of higher rates will continue.
Although there has been a slight improvement from earlier in the year, the True Financial Conditions Index still shows the U.S. having the tightest financial conditions since the 1980s.

Banks have been less willing to lend to consumers, which typically coincides with recessions.


Per the NY FED, rejections on consumers applications are increasing.


Corporate debt defaults in 2023 have already blown past last year's total, Moody's data shows. 55 US firms defaulted on their debt in the first-half, a 53% increase from total defaults in all of 2022. Global debt defaults could keep surging as financial conditions continue to tighten.
Moody's expects global corporate defaults to continue to surge, with the global default rate finishing the year at 4.7%. In an unlikely, but more severe scenario, the global rate could reach 13.7%, the firm said, surpassing that of the 2008 financial crisis.

US bankruptcies in the first six months of 2023 were the highest since 2010.


More than $500 billion storm of corporate-debt distress that’s already starting to make landfall across the globe, according to data compiled by Bloomberg. Debt loads that swelled during an era of unusually cheap money. Now, that’s becoming a heavier burden as central banks ratchet up interest rates and appear set to hold them there for longer than nearly everyone on Wall Street expected.

In the US, the amount of high-yield bonds and leveraged loans, which are owed by riskier, less creditworthy businesses, more than doubled from 2008 to $3 trillion in 2021, before the Federal Reserve started its steepest rate hikes in a generation, according to S&P Global data. Over the same period, the debts of non-financial Chinese companies surged relative to the size of that nation’s economy. And in Europe, junk-bond sales jumped over 40% in 2021 alone. A lot of those securities will need to be repaid in the next few years, contributing to a $785 billion wall of debt that’s coming due.
With growth cooling in China and Europe, and the Fed expected to continue raising rates, those repayments may be too much for some businesses to bear. In the Americas alone, the pile of troubled bonds and loans has already surged over 360% since 2021, the data show. If it continues to spread, that could lead to the first broad-based cycle of defaults since the Great Financial Crisis.
America’s $1.4T risky corporate loan market has been hit by the biggest slew of downgrades since the depths of the Covid crisis in 2020, as rising borrowing costs strain businesses piled high with floating-rate debt. The diminishing credit quality of junk loans follows the market’s explosive growth in recent years.
Crypto News
=> Celsius Network, a troubled crypto lending platform, is on the path to exiting bankruptcy with two settlements. Court filings on July 20 revealed the agreements, which aim to return assets to customers and end bankruptcy proceedings. Judge Martin Glenn will review the settlements during an August 10th hearing, addressing $78.2 billion in unsecured claims.
=> Bankrupt FTX files a lawsuit against former CEO Sam Bankman-Fried (SBF) and ex-executives, claiming they misappropriated over $1 billion in customer funds. The accused allegedly used the money for luxury condos, political contributions, and speculative investments. They're also accused of issuing $725 million in equity to themselves without offering value in return.
=> The American SEC took a significant step towards approving the first Spot Bitcoin ETF in the US by listing at least eight applicants, including BlackRock and Fidelity, in the Federal Register. However, the listing doesn't guarantee approval, and the SEC will conduct a thorough review, considering investor protection and market manipulation concerns. The decision rests with the regulatory agency and could pave the way for a new era of cryptocurrency investment. The review process may last up to 240 days, leaving the future of Bitcoin ETFs in the US uncertain.
=> The world’s most popular manufacturer of electric vehicles, Tesla, has shared its quarterly report for Q2 of 2023. The document revealed that the company didn’t sell any of its BTC.
=> Brian Armstrong, CEO of the leading US-based cryptocurrency exchange, Coinbase, will meet with US House Democrats. The point of the meeting is to discuss crypto regulations.
=> Ripple has achieved a huge victory against the US Securities and Exchange Commission, but the war is far from over. All eyes are now turned to the Commission to see if they will appeal the latest ruling.
=> The Federal Reserve on Thursday announced that its new system for instant payments, the FedNow Service, is now live. Banks and credit unions of all sizes can sign up and use this tool to instantly transfer money for their customers, any time of the day, on any day of the year.
=> The government of the US sold another 8200 Bitcoins that are connected to the Silk Road marketplace. This was confirmed by on-chain data according to an analyst from a popular on-chain analytics firm CryptoQuant.
Cryptos: spot, derivatives and “on chain” metrics
The past seven days have mostly been centered around Bitcoin and the aftermath of the ruling in the case between Ripple and the United States Securities and Exchange Commission. That said, the total market capitalization declined by some $11 billion throughout the same period, as investors are wary of future uncertainty.
Bitcoin’s price has largely remained around the $30,000 area, a pivotal level that consists of significant technical but also psychological resistance. BTC attempted a push above $31,000 halfway through the week but to no avail. The bears were quick to intercept and ruined the upward momentum, pushing the price to a weekly low at around $29,700.
Gainers / Losers last 7 days, block size volume.

The Ripple effect had a limited impact, although Bitcoin managed to reach new local highs, these gains were quickly reversed. That back and forth movement had left a minor operating event of weakness within this minor value area that we have been generating since late June. We believe it will most likely resolve as distributive with targets at the high volume node below $28100.
As we said last week, as long as the price remains above the high volume node of $28100 and the Vwap anchored to the previous local highs, the long scenario should be maintained. However, it is vital for the bulls to regain the upper volume node of $30,300 in order to be able to continue to raise bullish scenarios.
Bitcoin 17/07/23 30 min chart

Bitcoin 24/07/23 30 min chart

Moving up the timeframe, the scenario of effective bullish imbalance of the entire lower value area is still on the table. The verticality of the rise leaving a somewhat inefficient auction and the clash with the third typical deviation of the main Wwap are the only impediments to further upside for the time being. The market must hold the $28100 level and remain above the Vwap anchored at the previous local highs, losing this zone would put an end to any bullish continuation scenario.
Bitcoin 17/07/23 4h chart

Bitcoin 24/07/23 4h chart

The price of Bitcoin has been lodged within a narrow corridor for the past three months, and this can be explained by several key factors: Short-Term Holders, Miners, and Volatility.
Starting from April of this year, the STH (Short-Term Holders 0 days -6months) supply began to decrease. This group is actively selling off their #Bitcoin reserves, exerting significant pressure on the market.

Miners are actively selling their Bitcoin reserves. This is not a random occurrence; we have seen peak sales over the last year. This is connected to the upcoming halving event. Miners require liquidity to invest in new equipment.

This volatility index, which considers price volatility, inflow/outflow (funds flow into and out of the market), and net taker ratio (buyer-seller ratio), demonstrates a significant decrease in market activity starting from April this year.

Bitcoin on-chain and market data also show
- High leverage + negative funding
- Retail demand weakening and large speculators giving up
The estimated leverage ratio for Bitcoin futures remains at a historically high level, indicating higher volatility incoming. Interestingly, the overall funding rate has turned negative.


Large Speculators starting to give up on Bitcoin

Hodlers remain in a regime of accumulation, continuing to absorb coins at a rate of +27.1K BTC / month.

Tether's market cap has increased in tandem with Bitcoin's rising price, while USDC's market cap has declined considerably. In January 2023, USDT's market capitalization was $66bn and today it is $83bn. Likewise, in January 2023, USDC's market cap was $44bn, and today it is $27bn. As the banking crisis hit in early March, we subsequently saw USDC trade at a huge discount, while USDT has played an increasingly important role in Bitcoin's price movements in recent months.
Regulatory uncertainty has curiously made USDt a leading stablecoin for the cryptocurrency market. As is well known Tether is not an example of transparency and good practice for the sector.

Ethereum continues to resist breaking the Vwap anchored at all time highs. We need to see a real change of character, breaking this level in a strong way to build solid and consistent long scenarios. Any loss of buying response in the $1700 - $1500 area would set off all alarms.
Ethereum 17/07/23 4h chart

Ethereum 24/07/23 4h chart

We will closely monitor the evolution of BNB as a measure of risk perception. BNB is the cryptocurrency coin that powers the BNB Chain ecosystem. BNB is one of the world's most popular utility tokens and it is used primarily to pay transaction and trading fees on the Binance exchange. It is Binance's flagship token.
At first glance we note that the Vwap anchored at highs has never been exceeded or practically tested since late 2021. The vigorousness with which the Vwap anchored at the local lows of June 2022 has been broken through makes us aware of the major weakness on this token.
Binance achieves its 24th quarterly burn, permanently eliminating over $480 million worth of BNB tokens to maintain scarcity and boost value. The burning process, conducted every three months, aims to reduce the token supply to about 100 million. Initially, 1,991,854 tokens were burned, and 747.51 BNB tokens were destroyed through the Pioneer Burn Program. The transparent mechanisms used for burning, including BNB Auto-Burn and Real-time Burn (BEP-95), ensure verifiability. Despite the burn, Binance Coin (BNB) remains relatively silent.
Ripple´s effect has had no impact on BNB, which continues to dance on a tightrope. Clearly the area to watch is the historical support at $220, from there Binance could be in serious trouble.
BNB 10/07/23 4h chart

BNB 24/07/23 4h chart

Classic markets
Market positioning remains quite stretched, growing to 1.7, which is the highest reading since late 2021. This suggests that participants are very bullish about future prospects in risk assets, despite negative earnings growth and non-existent risk premiums in the S&P 500 and NASDAQ.

There are some signs that hedge funds are covering shorts in macro products (forex and rate derivatives), while adding shorts into staples, communication services, and tech before earnings season kicked off. Part of this may be hedging positions, but there may also be some directional bets to consider.

Analysts capitulation: Most Wall Street firms have revised up their SPX price targets for 2023.

“We observed that the recent rally has increased Momentum crowdedness within the market. The below Momentum correlation indicator suggests one of the sharpest rises in Momentum crowded risk in several years." JPMorgan.

“The equity risk premium is trading near pre-GFC lows despite a tough macro backdrop...indicating that equity markets are disconnected from underlying fundamentals." Barclays.

The NAAIM Exposure Index stands at 99.05, active investment managers remain very bullish, reaching levels coinciding with the market top in 2021.

This is the greediest the market has been since the 2022 peak, and active fund managers have clients positioned with the most bullish exposure since then. The chart of the SP500 marks the relative peaks of both the CNN Fear & Greed Index, and the NAAIM Exposure Index. Extreme greed and elevated exposure is a combination that has preceded all meaningful declines.

Retail traders are a lot more optimistic than professional traders.

Retail traders have never bought equities this aggressively in the runup to the 'official' start of an earnings reporting season.

The Goldman Sachs short basket is +20% relative to the SPX over the last two months (chart), one of the sharpest squeezes in the last 13 years.

SDEX is now at all time lows. SDEX is a measure of put skew and/or hedging demand, and this all time low suggests long put demand has cratered.SDEX Index is calculated by comparing the IV of a 30-day atm put option to the implied volatility of a 30-day otm put option.

We are now seeing MAGMA skew trade near all-time lows (1st%ile over 10yr) and AMZN, MSFT & GOOGL skew are all trading inverted (calls over puts).

Microsoft (yellow) and the notional volume moved by call options (black) each day.

Volatility is likely to rise from here. The SP500 has gone 37 days without a 1% decline, last seen at the November 2021 Top. Many similar streaks ended with some big Volatility spikes.

Summer trading is notorious for low volume, even complacency. Much of the market is currently at the lake, at the beach, or somewhere in the Western Mediterranean. But as July turns to August, volatility tends to rise, and it doesn’t stop there. Volatility continues to rise on average in September and October.

There has been a breakdown in the correlation between central bank liquidity and tech stocks this year.

The systematic positioning of “price agnostic” flows has been the main source of demand since the beginning of the year. These flows do not understand macro or fundamentals but are basically based on trends and volatility parameters, in fact, and according to the following graph, they show a significant divergence with respect to the ISM manufacturing. However, CTAs have little left to buy on a positively trending market, but with a momentum shift lower they will have between $10B and $70B worth of exposure to sell.

CTAs are full ”all in”.


Nomura’s McElligott said that 'target Vol/Vol Control funds have been a source of persistent equity demand over the past 9 months.The following chart that will go down in the books of finance and history, a true reflection of the derivative´s power, their disconnection from reality and their ability to drag the entire market like a big snowball where risk is ignored for the benefit of the last squeezed drop of the lemon.
These somewhat nuanced dynamics are important to understand because there are huge sums of equity tied to risk-based strategies using realized volatility. Vol control funds in particular control north of $250 billion AUM, which under the framework of an inelastic market, can affect asset prices with a 3-8x multiplier depending on liquidity. In other words, what seems like a minor detail can end up having a huge impact on both positioning and the broader markets.

However, after topping up equity allocations to near historical 90th percentile levels (+$160 billion) off the mid-2022 lows, projected and sustained daily SPX changes of + or – 1% would begin to force de-allocation from equities from the Vol Control universe. For example, we estimate that sustained daily moves of 1.0% for the entirety of this current week would trigger nearly $12 billion of US equity selling in aggregate from this cohort.'

Nomura warned that the low-vol environment might be misleading as macroeconomic visibility is poor and that 'the dispersion in forecasts for nominal GDP in the US had been mostly narrowing since the start of the year, but it has recently widened again in a way that hints at the potential for renewed volatility in US equities.'
Pay close attention to this data, as systematic positioning is “all in”, with little upside ammunition and a tsunami of positions to unwind if volatility kicks in.
CTAs have much more to sell in a down-market versus what they have to buy in an up-market, positioning is asymmetrically exposed to the downside. Barclays

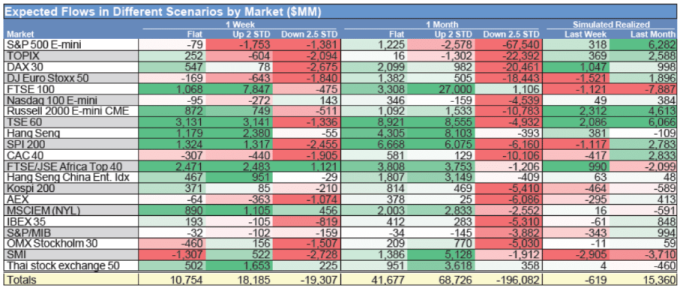
Goldman Sachs CTA Flows
Over the next 1 week
Flat tape: $10.8 billion to buy (-$79 million SPX)
Up tape: $18 billion to buy (-$1.8 billion SPX)
Down tape: -$19 billion to sell (-$1.4 billion SPX)
Over the next 1 month
Flat tape: $41.7 billion to buy ($1.2 billion SPX)
Up tape: 68.7 billion to buy (-$2.6 billion SPX)
Down tape: -$196 billion to sell (-$67.5 billion SPX)
Key pivot levels for SPX
Short term: 4,344
Med term: 4,197
Long term: 4,213
We are entering the famous window of weakness after Opex (options expiration) with potential risk catalysts, the Fed meeting, where the important thing will be the tone of Chief Powell's speech, and not the ultra-anticipated 25 bps hike and a week full of earnings. The market after Opex is in a freer situation as it is not influenced by the flows deriving from options.
As expected during the past week the market was not able to overcome the big gamma stack located at 4550-4600 points, but it also left some evident signs of weakness, first failed bullish dynamics were observed. As always, volatility will mark everything and now has a clear window to emerge.
In the big picture and despite all the climatic metrics shown in this newsletter, the price dynamics are bullish, the market has managed to maintain its path of higher highs and higher lows. We re-emphasize that everything could change radically if the market enters negative gamma and even more so with the systematic positioning all in.
The market turning point is the zero gamma, located at Friday's close at 4502.5 points.
17/07/23 SPX big picture

24/07/23 SPX big picture

Two weeks ago, the market overcame a situation of potential weakness. The red Vwap anchored at previous local lows was attacked twice, without success. All this caused the bulls to quickly take control of the market, propelling the price practically parabolically retracing only at the previous highs.
During the past week there has been a clear exhaustion of demand unable to overcome the gamma call wall and leaving a clear sellers' zone marked by the Vwap (blue) anchored at previous local highs. If supply is able to break through the Vwap (purple) that has been acting as support, this entire upper value area could resolve as distributive, opening the door to corrections.
For this week we continue with a neutral-bearish bias as long as the market is not able to consolidate above the Vwap anchored at the local highs.
17/07/23 SP500 futures small picture

24/07/23 SP500 futures small picture

Gamma Profile 17/07/23

Gamma Profile 24/07/23


