.png)


.png)
Summary
The labor market and services sector remain resilient, keeping the Fed on high alert. The S&P 500 was down slightly last week, while small-cap stocks underperformed large-cap equities. The key driver for this market disruption was stronger-than-expected labor market and services data, which drove bond yields higher and increased expectations for the fed funds rate to remain higher for longer
Stocks tried to rally Friday after the June jobs report came in weaker than expected. But it wasn’t enough to rescue a losing day and week for all three averages to kick off the second half of 2023. The ADP employment number was more than double the Street’s estimate and sent stocks reeling on concerns the Federal Reserve will resume raising rates to stamp out inflation. It was another “good news is bad news” moment.
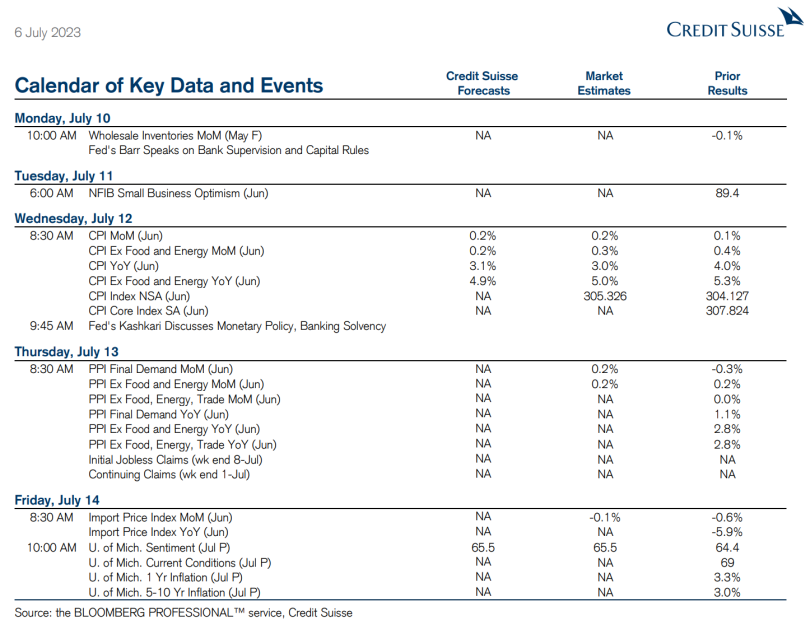
This week a couple of key inflation measures will provide some clues to the central bank’s next moves. The consumer price index (CPI) report drops Wednesday. A lot is riding on the CPI following the scorching hot ADP number. The Street wants to see a continued decline in the rate of price increases on an annual basis to show the Fed’s plan is working. On Thursday, the producer price index (PPI) is out and will show the change in selling prices received by producers of goods and services.
Earnings season begins this coming week with big U.S. banks reporting. Wells Fargo and the big banks report second-quarter earnings on Friday after breezing through the Fed’s stress tests late last month, paving the way for them to issue share buybacks and dividends. The Fed's annual health check indicated that large lenders have enough capital to weather a severe economic downturn, but now it’s time for earnings. After the turmoil in the banking sector earlier this year analysts will also be focusing on what banks have to say about the outlook for lending and how much they set aside in rainy-day funds to cushion losses from souring loans.
China is to release inflation and trade data in the coming week which is likely to underline that the post-COVID recovery in the world’s second-largest economy is faltering amid increasing deflationary pressures, high youth unemployment and lackluster foreign demand
After months of tightening of restrictions by the U.S. and key allies on chip-related imports, Beijing has hit back with curbs on chip-making metal exports. Washington has been curbing Chinese companies' access to cloud-computing services. The ongoing chip battle between the U.S. and China could escalate, despite both sides stating they want to de-escalate tensions and avoid a trade war.
BlackRock CEO Larry Fink called Bitcoin “digital gold” and an international asset as the world’s largest asset management firm pushes to list a Bitcoin ETF. Thailand’s SEC implements rules to protect investors, including prominent risk warnings and banning the use of customer funds for lending or investment.
Several top officials have departed Binance, the leading centralized crypto exchange, as it prepares to defend itself on multiple fronts. Departures include General Counsel Han Ng, Chief Strategy Officer Patrick Hillmann, and Compliance Senior Vice President Steve Christie. In addition, Binance’s Global VP of Marketing and Communications, Steve Milton, left in June, and the exits are reportedly linked to CEO Changpeng “CZ” Zhao’s handling of a US Department of Justice investigation. CZ, however, explained in a tweet how turnovers are a common occurrence in every organization. These came as Binance faces scrutiny from global regulators, including lawsuits from the SEC and CFTC.
Macro and news
U.S Macro data
The main factor weighing on sentiment during the week appeared to be Wednesday’s release of the minutes from the Federal Reserve’s last policy meeting. The minutes revealed that, while the decision not to raise rates in June was unanimous, some members would have preferred another increase. Expectations that rates would remain “higher for longer” were deepened Thursday, after Dallas Fed President Lorie Logan, one of those who argued for a rate hike in June, told a gathering of the Central Bank Research Association that she anticipated two more rate increases in the remainder of the year. In response, markets began pricing in a roughly 44% chance of two or even three quarter-point hikes by December.


The Labor Department reported that employers added 209,000 nonfarm jobs in June, modestly below expectations and the lowest number since December 2020. The previous two months’ gains were also revised lower by a total of 110,000 jobs. The unemployment rate edged down from 3.7% in May to 3.6% in June.


Last week's ISM (Institute of Supply Management) data continued to show relative strength in services sectors, versus an ongoing contraction in manufacturing. The ISM Services Index for the month of June came in at 53.9, versus an expected 51.2 and above last month's 50.3 reading. Readings over 50 indicate expansion. Among the 18 services sectors, 15 expanded in June, including lodging and food services, and entertainment and recreation, building the case for an ongoing demand for services broadly.
Meanwhile, the ISM manufacturing component continues to show signs of softness. The reading for June came in at 46.0, below expectations of 47.1, and in contraction territory for the eighth straight month. All of the components were below 50, and the only positive takeaway in this release is that new orders contracted at a slower rate in June. This reflects the dichotomy of the macroeconomic backdrop currently, with parts of the economy remaining resilient while other segments are softening, particularly those more sensitive to higher interest rates.


Americans saved about $2.1 trillion more than would have been expected in the first 15 months of the pandemic. As of May 2023, the value of these “excess savings” accumulated since the start of the pandemic was worth less than $600 billion, and the entire total will probably be gone by the end of the year if current trends persist. For now consumers are down to $533bn in excess savings.


Credit card troubles; with delinquency rates at 2008 levels. Credit card and auto loan delinquencies continue to rise, and these trends will continue with the Fed on hold well into next year.

Eurozone macro data
German data for industrial production, factory orders, and exports pointed to continuing economic weakness in the second quarter. Output in May fell 0.2% versus April, disappointing consensus expectations that had called for industrial production to come in flat.

New orders surged 6.4% in May on increased demand for ships, spacecraft, and military vehicles. However, on a three-month basis, this metric was still down 6.1% sequentially.

Eurozone PPI dumps into deflation, PMIs fall. Eurozone factory gate prices fell 1.9% sequentially in May and 1.5% YoY mainly due to a drop in energy costs, according to the European Union's statistics office.

The Eurozone Composite PMI (Manufacturing & Services) dipped below 50 in June, the first time this year.

The Citi Economic Surprise Index for the eurozone continues to decline, which is not good news.

UK macro data
House prices fell 2.6% year over year, according to home loan provider Halifax. This marked the largest such decline since 2011 and mortgage rates are still rising.

Japan macro data
The yield on the 10-year Japanese government bond (JGB) rose to 0.44% from 0.39% at the end of the previous week. Speculation that the BoJ could adjust its policy of yield curve control at its July meeting, possibly allowing JGB yields to fluctuate beyond the current range of around plus and minus 0.5 percentage points from zero, exerted some upward pressure on domestic yields. However, according to the Nikkei newspaper, BoJ Deputy Governor Shinichi Uchida said that the central bank will maintain its yield curve policy. We believe that sooner or later they will have to make a major change.
Following the spring “shunto” labor talks, which concluded in March and secured the biggest pay increases in decades, nominal wages in Japan rose 2.5% year on year in May, well ahead of expectations.
Finance Minister Shunichi Suzuki said that Japanese and U.S. authorities were in close contact on currency moves. Japan’s monetary authorities have previously asserted that all options are on the table to cope with excess volatility in the foreign exchange markets.
China macro data
The private Caixin/S&P Global survey of manufacturing activity eased to 50.5 in June from May’s 50.9 as expansion of manufacturing output and new orders softened.

China services growth softens in a fresh sign of weakness.

Premier Li Qiang, the country’s second-highest ranking official, pledged to "spare no time" in implementing a batch of targeted policies to strengthen China’s post-pandemic recovery. Li stated that China is at a critical stage of economic recovery and industrial upgrading and that comprehensive, well-coordinated measures are necessary to stabilize growth and employment.
Bonus macro data
A rise in bankruptcy filings points to increasing bankruptcies, loan charge-off rates and delinquencies, suggesting credit spreads are not reflective of the underlying credit backdrop. It does look like credit spreads might be the outlier.

The bankruptcy filings compiled from Bloomberg data is weekly, while Chapter 11 data is quarterly and lagging. As the chart below shows, the weekly data leads the official Chapter 11 series. Also note bankruptcies themselves lag the business cycle, with the peak seen at the end of the recession. (Shown in the chart below for 2008, and 2020, but less so for the latter when extraordinary measures were taken to limit bankruptcies in the pandemic. Chapter 11 filings heavily lagged in the 2001 recession, not peaking until 2003/04.

It looks like the credit environment is set to worsen, but spreads appear to be nonchalant. Their lack of reaction so far may be due to repressed equity volatility.

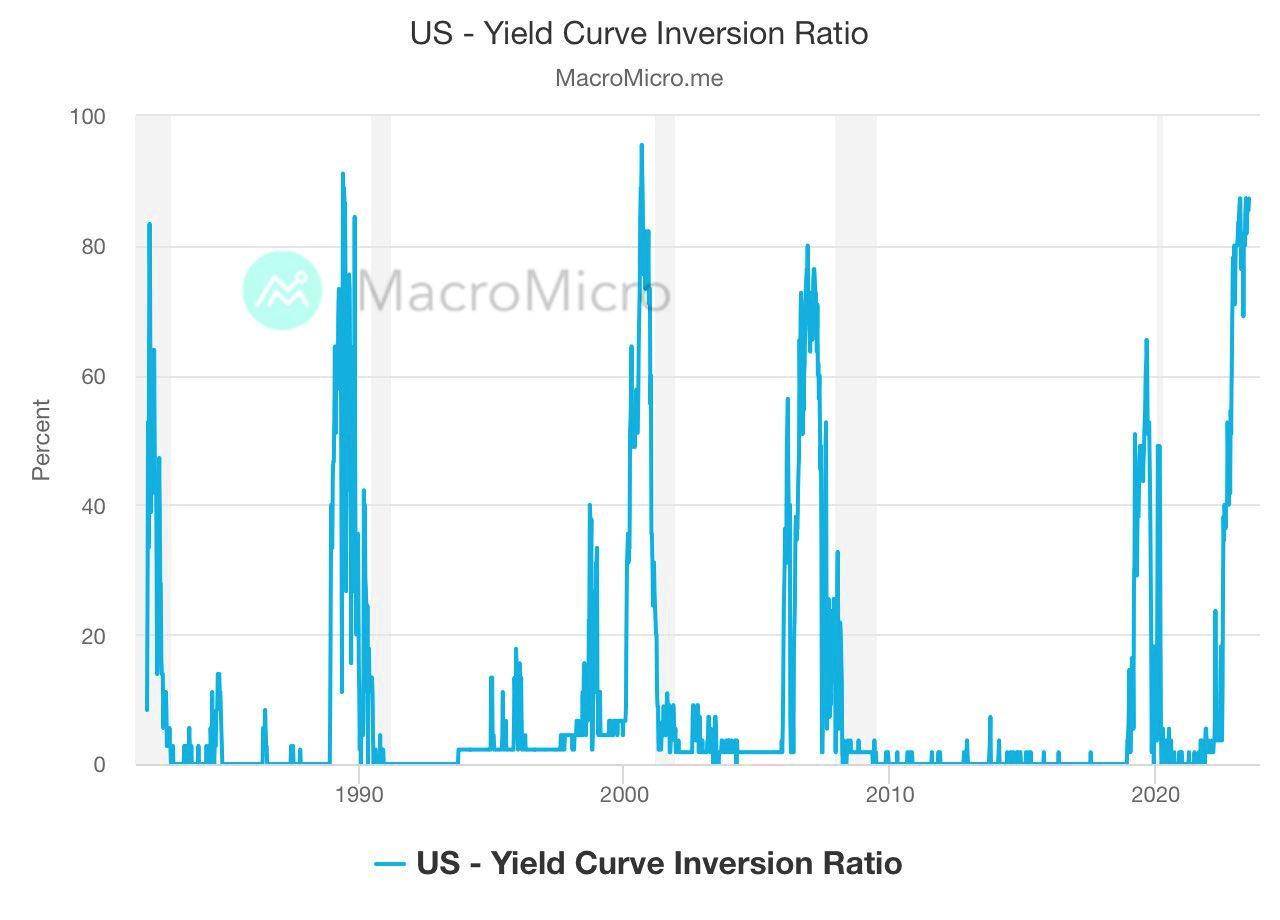
The yield curve inversion ratio is nearing 90% now, historically a reliable leading indicator. Historically 10 year 3 month inversions precede recessions by ~12mths (ranging from 5-17 months). Initial claims and continuing claims tend to gradually rise & bounce around at the beginning.


Crypto News
=> BlackRock CEO Larry Fink has once again shown his support for cryptocurrencies, calling Bitcoin (BTC) “digital gold” and an international asset. As mentioned last week, the world’s largest asset management firm is seeking to list a spot Bitcoin ETF, indicating increased involvement by traditional finance giants in the crypto space.
Fink believes Bitcoin plays a crucial role in digitizing gold and suggests regulators consider ETFs linked to it. He also believes that Bitcoin’s independence from any specific currency makes it an alternative asset for hedging against inflation and currency devaluation
=> Thailand’s SEC has implemented new rules for digital asset providers to protect investors. The country’s regulator prohibits using customer funds for lending or investment, banning crypto lending services and any return on customer deposits. Moreover, platforms must prominently display a warning message about the high risks of crypto and gain customer consent before use.
=> CFTC investigators have determined that bankrupt crypto lender Celsius and its ex-CEO, Alex Mashinsky, broke US regulations. The findings reveal that Celsius and its CEO misled investors, failed to register with the regulator, and violated multiple rules. However, If CFTC commissioners agree, a case could be filed in federal court this month
=> Several top officials have departed Binance, the leading centralized crypto exchange, as it prepares to defend itself on multiple fronts. Departures include General Counsel Han Ng, Chief Strategy Officer Patrick Hillmann, and Compliance Senior Vice President Steve Christie.
In addition, Binance’s Global VP of Marketing and Communications, Steve Milton, left in June, and the exits are reportedly linked to CEO Changpeng “CZ” Zhao’s handling of a US Department of Justice investigation. CZ, however, explained in a tweet how turnovers are a common occurrence in every organization. These came as Binance faces scrutiny from global regulators, including lawsuits from the SEC and CFTC.
=> Founder and CEO of crypto exchange Gemini, Cameron Winklevoss, is again threatening to sue Digital Currency Group (DCG) and its CEO Barry Silbert over delays in resolving the issue of funds owed to Gemini by bankrupt lender Genesis, slamming the CEO for allegedly trying to play the victim card.
In the July 4 “Open Letter to Barry Silbert,” Winklevoss alleged the DCG enterprise had engaged in “fraudulent behavior” via a “culture of lies and deceit”, coming at the expense of Gemini’s 232,000 Earn users. Most disturbing, according to Winklevoss, has been Silbert’s apparent claim of being the “victim” in the debacle.
“It takes a special kind of person to owe $3.3 billion dollars to hundreds of thousands of people and believe, or at least pretend to believe, that they are some kind of victim,” said Winklevoss, adding: “ not even Sam Bankman-Fried was capable of such delusion”.
DCG’s Genesis was the lender behind Gemini’s Earn program, which promised returns as high as 8% to depositors. However, on Nov. 16, 2022, Genesis announced it temporarily suspended withdrawals, citing “unprecedented market turmoil.” Genesis later filed for bankruptcy on Jan. 19, 2023, with Gemini seeking to recover its share of the billions owed by Genesis to creditors since.
Cryptos: spot, derivatives and “on chain” metrics
Spot Bitcoin exchange-traded funds (ETFs) are arguably the hottest topic in the cryptocurrency community for the past few weeks. Recall that the SEC deemed all recent filings as “inadequate” last Friday, which put a major shade on all applications on whether they will be added to the growing list of rejections made by the securities regulator. However, all companies reacted swiftly and refiled with more “adequate” information, mostly regarding their strategies on how to tackle potential market manipulation. BlackRock was among those, as it named Coinbase as its surveillance partner.
This week has been turbulent for most cryptocurrencies, with many facing new resistance at new levels. Bitcoin has had a quiet week, down 0.7% from its previous weekly price, with a price of $30200 as of press time as the cryptocurrency continues encountering resistance at the $31000 mark. Ethereum has also had a sluggish week, with prices now at $1867, down 2.6% from the previous week’s.
Gainers / Losers last 7 days, block size volume.

The market has been generating value in the area of previous highs for 3 weeks now. It seems that during the last weeks we have witnessed this process of consolidation of gains and breaks of relevant levels on the demand side.
As we said last week, as long as the price remains above the high volume node of $28100 and the Vwap anchored to the previous local highs, the long scenario should be maintained.
Bitcoin 03/07/23 30 min chart

Bitcoin 10/07/23 30 min chart

Moving up the timeframe, the scenario of effective bullish imbalance of the entire lower value area gains strength. The verticality of the rise leaving a somewhat inefficient auction and the clash with the third typical deviation of the main Wwap are the only impediments to further upside for the time being.
The conquest of the Vwap anchored at the previous local highs and the HVN of $28,100 would open the door again to a clear medium-long term long scenario.
Bitcoin 03/07/23 4h chart

Bitcoin 10/07/23 4h chart

Metrics “on chain” and specifically on derivatives show us the classic profit taking. The taker buy/sell ratio shows strong selling pressure after the equilibrium reached by the price after the big spike three weeks ago. It is worth noting that despite this selling pressure, the market has managed to remain in equilibrium above the $30,000 level.

The price is holding up despite the realization of big profits.

Short-term holders are realizing profits. Short-Term Holder are recording elevated levels of Exchange interaction in both magnitudinal and durational terms, sending +617,000 BTC to exchanges across the last 20 days.

Bitcoin was actively bought from February 16th to May 8th, after which it started being actively sold. People bought it for $20,000 and sold it for $30,000.

As we said last week, a bull market can start led by derivatives, but it is now where the organic demand for spot has to take a relevant role and start leading the movements. At the moment we are not seeing significant spot activity, as evidenced by the spot to futures volume ratio.

Despite the increase in volume during the month of June, the overall trend continues to be downward. It looks like we are getting back to May's daily Exchange trading levels.


Confidence in the crypto Exchanges is seen declining after FTX collapses.


Mining companies have not lost steam since the beginning of the year, especially after the growing institutional interest generated by ETF applications.

Bitcoin miners sent 54,000 BTC to Binance in the past 3 weeks. No significant change in BTC-USD open interest, suggesting less likelihood of filling collaterals to punt new long positions. Spot selling seems more likely.

The market is still unable to consolidate above the Vwap anchored at all-time highs, although the lower buy response zone is clear. In order to propose an analysis with a solid long approach, we continue to insist that the market must consolidate and conquer the Vwap anchored at all time highs. The price dynamics are progressing well enough to continue thinking in a bullish scenario, although we are starting to have a neutral bias due to lack of momentum.
Ethereum 03/07/23 4h chart

Ethereum 10/07/23 4h chart

We will closely monitor the evolution of BNB as a measure of risk perception. BNB is the cryptocurrency coin that powers the BNB Chain ecosystem. BNB is one of the world's most popular utility tokens and it is used primarily to pay transaction and trading fees on the Binance exchange. It is Binance's flagship token.
At first glance we note that the Vwap anchored at highs has never been exceeded or practically tested since late 2021. The vigorousness with which the Vwap anchored at the local lows of June 2022 has been broken through makes us aware of the major weakness on this token. Clearly the area to watch is the historical support at $220, from there Binance could be in serious trouble.
BNB 03/07/23 4h chart

BNB 10/07/23 4h chart

Classic markets
Overall, markets continue to view the strong labor market and healthy services demand as a signal that the Federal Reserve may ultimately keep interest rates higher for longer. Investors now expect the Fed to raise rates once more at the July meeting, bringing the fed funds rate to 5.25% - 5.5%, and keep them here until May 2024. We believe the Fed will raise rates in July and then remain highly data dependent.
From a market perspective, there have been implications of this "higher for longer" view for both bonds and stocks. In the bond market, Treasury yields have climbed higher, as both the 10-year and 2-year yields head toward highs of the year, with the 10-year near 4% and the 2-year near 5%.


Historically 10 year 3 month inversions precede recessions by ~12 months (ranging from 5-17 months). Gains made by the S&P are common during this time period, usually early to midway through the inversion cycle.

On valuations, treasuries are cheap, and stocks are not. By itself that means bonds have the advantage, but bonds also disproportionately benefit in the event that global recession does indeed set in. The leading indicator affirms this notion in the chart below.

Global liquidity was smashed lower this week. That is, the Fed's balance sheet fell -$42.6B week-over-week “wow”, while the ECB's balance sheet fell -$511.3B wow, with the BoJ's balance sheet falling -$133.3B wow (the balance sheets for the BoE + PBoC + BoK + BoC + BCB + SNB + CBC were flat wow). This means there was a net fall in Central Bank "CB" liquidity of -$687.2B this week, taking the aggregate of all CB balance sheets to the lowest level since 10/7/20.
Liquidity measure has a 98.4% R² correlation to the S&P 500 index since Jan. 2009, by FAR the strongest indicator for stock market performance.


AAPL is now bigger than the entire Russell 2000 and the top five names are 3.5x the market cap of small caps.


One of the most interesting charts surfaced this week. Retail is back, says JP Morgan. "Retail investors saw the greatest buying in 15 months, with buying in single stocks coming back; Equity ETFs saw strong inflows as well."

A soft corporate-earnings season poses the next test for stock market rally.

As earnings share of the Tech sectors has declined further, market cap weighting has increased.

Tech is still in FOMO, fund flows at their highest.

40% of Nasdaq composite stocks are still down by 75% or more from their 2-year highs.

The systematic positioning of “price agnostic” flows has been the main source of demand since the beginning of the year. These flows do not understand macro or fundamentals but are basically based on trends and volatility parameters, in fact, and according to the following graph, they show a significant divergence with respect to the ISM manufacturing. However, CTAs have little left to buy on a positively trending market, but with a momentum shift lower they will have between $10B and $70B worth of exposure to sell.


Last week we commented the following: “...This week we will again remain on the sidelines of the market. Despite the insistence to continue rising, we define the moment as climatic and even more so in view of the closing of trimesters and semester where many rebalancing and make-up movements take place. Certainly we see the upward movement as very exhausted, for all that has been exposed in this newsletter, and we believe that there is little to gain and much to lose on the upside. We will closely follow the zero gamma level (inflection point) which now stands at 4357.5 points for the SPX, as it is the clear turning point of the market and where volatility may kick in..”
The market has experienced rejection of the upper gamma stack between 4425 and 4500 points and is dangerously close to the gamma flip at 4400 points. In this zone the market changes radically, the market enters in a negative gamma regime, with market makers hedging in favor of the market and predictably providing volatility.
If the market sustainably stays below the gamma flip we believe the next target will be the previous low as marked on the charts. Such lows could open the door to a severe unwind of positions by the systematic flows that have dominated much of this rally. There is a clear risk-off ahead.
03/07/23 SP500 futures big picture

10/07/23 SP500 futures big picture

On a more detailed chart of the SP500 futures, a breakout and inside test at the red Vwap anchored at the previous lows would clearly open the door to a risk-off scenario. Last Friday's round-trip movement is a clear sign of selling initiative not seen for some time. Our bias is bearish as long as it remains below the red Vwap mentioned above.

The gamma profile of the market has experienced significant changes. It seems that puts are not dead! There is even interest in puts out of the money. The slope of the SPY gamma curve is steep and certainly dangerous.

Gamma Profile 03/07/23

Gamma Profile 10/07/23


