.png)


.png)
Summary
Last week the markets were jittery in anticipation of two major events: Jerome Powell’s speech at Jackson Hole, and Nvidia’s earnings report. Both created volatility in advance of their releases, and both caused the markets to reverse course after the deed.
U.S. Federal Reserve Chair Jerome Powell said on Friday that the Fed is prepared to approve further interest-rate increases at some point but will “proceed carefully.” Speaking in Jackson Hole, Wyoming, Powell cautioned that past increases haven’t yet fully cycled through the economy, and he indicated the Fed will await further economic data as it decides on the timing of any further hikes.
The potential for further rate hikes sent short-term U.S. Treasury bond yields higher, as the 2-year yield jumped on Friday to around 5.06%, roughly equal to a year-to-date high reached on March 8. The last time the 2-year yield remained above 5.00% for an extended period was in mid-2000.
The U.S. stock market recovered from a three-week losing streak this week, U.S. stocks finished the week mostly higher with the Dow Jones Industrial Average down 0.5%, while the SP500 gained 0.8% and the Nasdaq climbed 2.3% for the week.
Economic red flags in sight? A pair of reports indicated a slowdown in U.S. economic activity. New orders for durable goods fell 5.2% in July to post the biggest monthly decline in more than three years and business activity fell to a six-month low. European currencies and yields of European government bonds both fell on Wednesday after a report showed that business activity across Europe declined to the lowest level in nearly three years, as measured by a survey of purchasing managers. A separate business activity report in Germany showed the steepest monthly decline in more than three years.
This week, the July personal consumption expenditure index (PCE), the Fed’s preferred measure of inflation, and the latest monthly employment report will offer another trial for the markets as investors assess whether stocks can defend their recent gains under the “cloudy skies” of uncertainty over the economic outlook.
Investors need the “Goldilocks scenario” where economic growth is slowing, but not falling off a cliff, which would suggest that the Fed is closer to being done raising interest rates. However, the assessment of the precise level of monetary policy restraint is complicated by uncertainty about the duration of the lags with which monetary tightening affects economic activity and inflation, Powell said on Friday, noting “the wide range of estimates” of these lags suggests that there may be “significant further drag” in the pipeline.
Bitcoin, the largest crypto token, was down 0.32% for the week. In the past two weeks, it has fallen almost 12% after trading sideways for about a month. The pullback was also partly due to a broader correction in risk assets such as equities, induced by frothy positioning in tech, higher US real yields and growth concerns about China. It is noteworthy that the classic "buy the dip" did not take place after this wild derivatives liquidation movement, leaving the market in a situation of technical weakness.
Ethereum, the second biggest cryptocurrency by market capitalization, matched Bitcoin’s pace. At its current price of $1,655, it is down 1.2% from last week. Broadly speaking, most top thirty cryptocurrencies retained their value. The only notable depreciation over the last seven days fell upon holders of Uniswap (UNI) and Avalanche (AVAX). AVAX fell 7.2% to $10.02, while UNI crashed 7.9% to $4.58.
Macro y news
U.S. Economic Calendar

Euro Area Economic calendar

With most of the world enjoying the holiday season, here are some of the most important events for the coming months:
AUGUST
▪️31: US PCE
SEPTEMBER
▪️1: Employment report
▪️9-10: G20 Summit
▪️13: US CPI
▪️14: UAW Labor Union contract w GM, Ford, Stellantis
▪️20: FOMC
▪️29: PCE
▪️30: End Government Fiscal Year. $1.2T of T-Bill issuance needed by then
OCTOBER
▪️1: Student Loan payments due (unless taking 1 extra year interest accrues)
▪️6: Employment report
▪️9-15: IMF World Bank meeting
▪️12: US CPI
▪️27: US PCE
NOVEMBER
▪️1: FOMC
▪️3: Employment report
▪️14: US CPI
▪️30: US PCE
Earnings for this coming week:

U.S Macro data
Jackson Hole symposium
From an investor's viewpoint, late August is when the attention turns to the Federal Reserve's annual Jackson Hole symposium, which offers policymakers an opportunity to outline broad policy shifts. In the past, Fed chair speeches have created a buzz and set the tone for the markets. That was certainly the case one year ago when Jerome Powell, in a short and pointed speech, telegraphed the Fed’s determination to defeat inflation even if it results in “some pain” for U.S. households. Fast forward to this year. Powell's speech was still hawkish but more balanced, highlighting data-dependency and keeping options open.
Chair Powell’s speech at Jackson Hole confirmed market expectations that the Fed is willing to hold rates higher for longer. Powell did not rule out further rate hikes and reinforced the Fed’s commitment to reducing inflation to the Fed’s two-percent target. That somewhat hawkish tone was softened by a focus on evolving price and labor market data, with an acknowledgment that the current policy stance is restrictive.
Three key takeaways:
1) 2% is and will remain the Fed's target: Chair Powell pushed back on speculation that the Fed could tolerate or raise its inflation target, as some academics and market participants have recently suggested. Powell acknowledged the recent softer inflation reports, but he highlighted that this is “only the beginning of what it will take.”
2) Officials are determined to keep at it until the job is done: The Fed is prepared to raise interest rates
further if needed and intends to keep borrowing costs high until inflation is on a convincing path toward the Fed’s target (a hint on rates staying higher for longer if data warrants). To achieve that will likely require a period of below-trend economic growth and some softening in labor-market conditions.
3) Risk management speech: “Given how far we have come, at upcoming meetings we are in a position to proceed carefully”. “We will proceed carefully as we decide whether to tighten further or, instead, to hold the policy rate constant and await further data”.
While acknowledging the extent to which inflation has come down from its peak, Chair Powell left the door open to further rate hikes, if necessary, until the Fed sees evidence of inflation progressing towards its two-percent target. The speech was viewed as somewhat hawkish, as Powell referenced the possibility of further hikes, reinforced the “higher-for-longer" narrative, and did not discuss policy loosening. He concluded, “we are navigating by the stars under cloudy skies.” That said, the hawkish perspective was largely already priced into the market, with rates traders having previously extended their bets of when the Fed will begin cutting rates to June 2024.

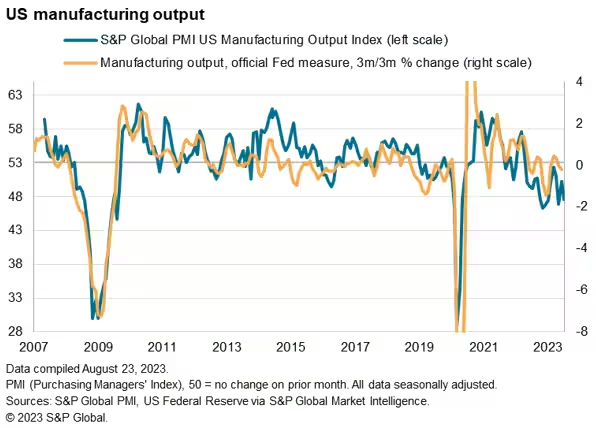
Durable goods orders data released Thursday indicated a somewhat higher degree of business caution, at least in certain areas. While durable goods orders, excluding defense and transportation, commonly accepted as a proxy for business investment, rose 0.1% in July; this was more than offset by a downwardly revised 0.4% contraction in June. S&P Global’s index of manufacturing activity also fell more than expected in August, reversing most of July’s strong gain and moving further back into contraction territory.

The University of Michigan’s final reading of August’s consumer sentiment, released Friday, fell a bit from July’s nearly two-year high, seemingly due to higher inflation expectations following the recent increase in gas prices.

Several retailers reported second-quarter results, which arguably offered a generally cautious picture on the health of the U.S. consumer. Shares of department store operator Macy’s fell sharply after the company reported falling earnings and warned of growing consumer caution, along with rising credit card delinquencies. Macy’s competitor Nordstrom, while beating earnings and revenue estimates, also cited rising late payments on its credit cards in issuing a cautious outlook. Nordstrom, discount chain Dollar Tree, and specialty retailer Dick’s Sporting Goods noted that earnings suffered from exceptionally high levels of theft from their stores.
The housing sector appeared more robust, with new home sales reaching their highest level in July since early 2022, despite the highest mortgage rates in years. Freddie Mac reported on Thursday that the 30-year fixed rate mortgage had reached its highest level since 2001. Existing home sales fell back and missed expectations, however.


Eurozone macro data
Economic data pointed to a weakening European economy, prompting financial markets to pare expectations on future interest rate increases. Initial results from a survey of purchasing managers compiled by S&P Global indicated that business activity in the eurozone likely shrank for a third consecutive month. The Purchasing Managers’ Index (PMI) for manufacturing came in at 43.7, a slight improvement from July but still well below 50, the level that indicates a contraction in activity. Meanwhile, the PMI reading for the services sector dipped below 50. The HCOB Flash Eurozone Composite PMI Output Index, which combines data from both sectors, fell to a 33-month low of 47.0 from 48.6 in July.

Germany PMI Manufacturing ticked up from 38.8 to 39.1 in August. PMI Manufacturing Output fell from 41.0 to 39.7, a 39-month low. PMI Services tumbled sharply from 52.3 to 47.3, a 9-month low. PMI Composite dropped from 48.5 to 44.7, a 39-month low.

German companies appeared to become more pessimistic in August. The Ifo Institute’s business confidence index fell for a fourth consecutive month to 85.7, its lowest level since October 2022.

UK macro data
UK business activity recorded its weakest month in August since January 2021, according to S&P Global/CIPS. The Flash UK PMI Composite Output Index fell to 47.9 from 50.8 in July, the first contraction since January. New orders shrank for a second consecutive month.

Japan macro data
Flash composite PMI data, combining both manufacturing and services sector activity, rose to 52.6 in August, up from 52.2 in July. And while Japan factory activity shrank for a third consecutive month in August, data showed the pace of decline was slowing.

The yield on 10-year Japanese government bonds rose sharply during the week, moving as high as 0.68% at one point, the highest level in almost a decade. The recent shift in the Bank of Japan’s yield curve control strategy, favoring more flexibility and less direct intervention, prompted selling of Japanese debt. Yields retreated by the week’s end, settling around 0.65%, after global PMI data suggested weakening economic activity.
The yen continued its weaker trend of recent months, finishing the period in the low JPY 146 range against the U.S. dollar. The value of the yen has tumbled to levels approaching those reached in September/October 2022—lows that prompted the Bank of Japan to step in to support the flagging currency.

China macro data
Disappointing data, signs of deflation, record youth unemployment, and continued liquidity problems in the debt-laden property sector have contributed to an erosion of confidence in China’s economy. Signs of deteriorating growth, and a sense that China’s government has relatively few good options to arrest the downturn, have raised the prospect of accelerated capital outflows.

Chinese stocks are now underperforming US stocks by the most since 2001.Meanwhile, China’s HY real estate index is down a massive 82% in just over 2 years. This puts the index back down to 2008-levels. Adding to this, Evergrande just filed Chapter 15 bankruptcy.


However, the risks of a systemic crisis emanating from China’s property sector appear low. Moreover, the riskier “shadow” banking system, which includes trusts, is smaller today than it has been in recent years thanks to increased regulation. As a result, we believe that the key risks are at the periphery of its financial system and potentially resolvable through regulatory intervention. Nevertheless, it is important to closely monitor developments in the real estate sector and their potential impact on other sectors.
Bonus macro data
Gradually, the alarm bells over credit are beginning to ring. Monetarist and Austrian School economists are hammering the point home about broad money, which almost everywhere is contracting. It is overwhelmingly comprised of deposits at the commercial banks. And this week, even China’s command economy has had credit problems exposed, with another large property developer, Country Garden Holdings missing bond payments.
A global cyclical downturn in bank credit is long overdue, and that is what we currently face. Empirical evidence of previous cycles, particularly 1929-1932, is that fear can spread through the banking cohort like wildfire as interbank credit lines are cut, loans are called in, and collateral liquidated. The question arising today is whether the current credit cycle downturn is more acute than any of those faced by our fiat currency world since the 1970s, or whether timely expansions of central bank liabilities can come to the rescue again.
The problem with using monetary policy to avert a financial crisis is that there is bound to come a time when it fails, particularly when it is driven by bureaucrats whose starting point is an assumption that banks are adequately capitalized for an economic downturn. This ignores unproductive debts from previous cycles which have simply accumulated into a potential tsunami of defaults. When it overwhelms the banks, the policy response can only be so destructive of the currency that the cure exacerbates the problem. And with bond yields rising again, there are good reasons to believe that a tipping point is now upon us.
Below is a chart of the US money supply. Since 2020, the US has printed nearly 80% of all US Dollars in circulation. To put that in perspective, at the start of 2020 we had ~$4 trillion in circulation. Now, there is nearly $19 TRILLION in circulation, a 375% jump in 3 years. We are paying the price for trillions of Dollars that were printed seemingly overnight. Why is the Fed surprised that inflation hit a 40-year high?

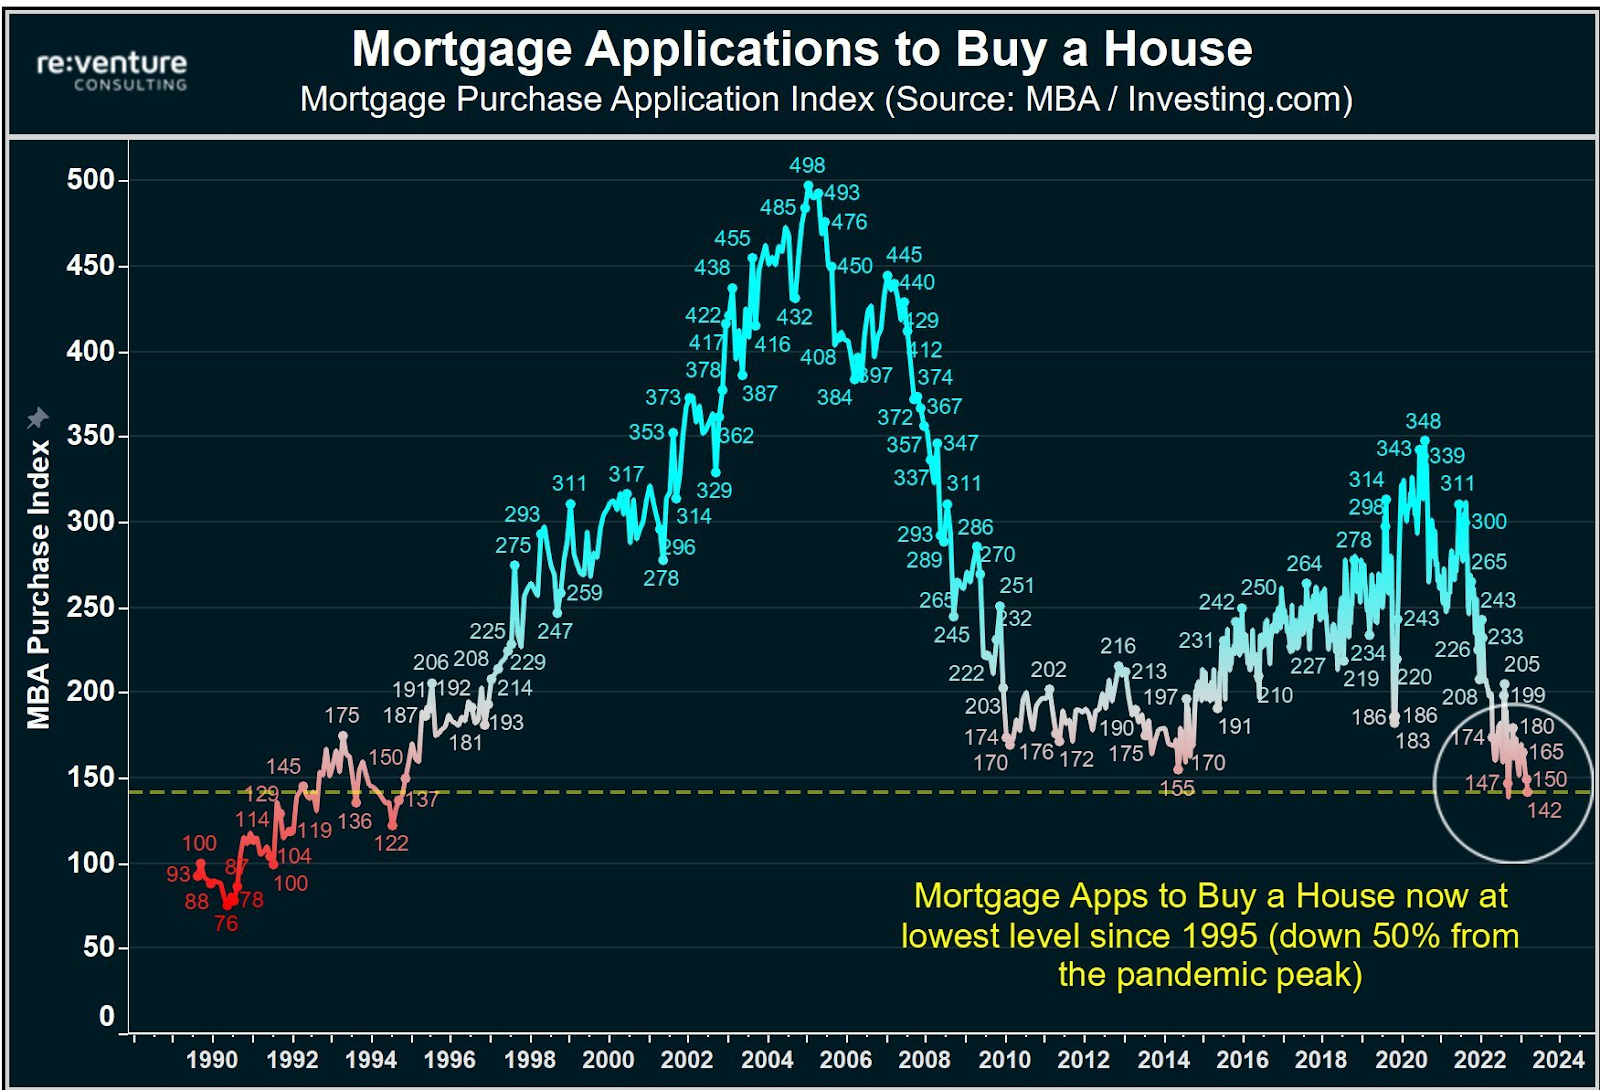
Mortgage demand is now at its lowest level since 1995 and still falling sharply. To put this in perspective, mortgage demand in 2005 was ~300% above current levels.Since 2021, mortgage demand is down a massive 60%. Meanwhile, existing home sales are down 16% this year, their lowest since 2010. No one wants to sell and no one wants to buy. Truly historic times. Markets are finally feeling the effects of the fastest rising interest rates in history.Ironically, we are likely going to need lower rates for prices to fall. Lower rates are needed for supply to return.
Median cost to buy a house hits a new record of $2,748/mo, up a massive 90% since 2020. In other words, buying a house today costs nearly $33,000 per year. This is 46% of the median PRE-TAX household income in the US. Post-tax, homebuyers in the US are spending nearly 70% of their income on home payments. Meanwhile, the median monthly apartment rent just hit a fresh record of $1,859/mo. Even in the 2008 housing bubble, the median cost to buy a house peaked at $1,500/mo. We are at nearly double that level and quickly rising. If the Fed continues raising rates, affordability will only get worse.

Household debt increased by $16 billion, totaling $17.06 trillion in the second quarter of 2023, as per the recent NY Fed Quarterly Report on Household Debt and Credit. Credit card balances surged, adding $45 billion and hitting a series peak of $1.03 trillion. Other balances, encompassing retail credit cards, consumer loans, and auto loans, went up by $15 billion and $20 billion, respectively. Student loan balances decreased by $35 billion, settling at $1.57 trillion, while mortgage balances remained consistent at $12.01 trillion. This is to say, nothing of personal savings rates headed back down after a slight recovery in 2023.

The impact of interest rates on credit card holders is evident. However, it's even more startling when examining mortgages. With 30-year mortgage rates now over 7%, a house purchased for $500k with 20% down would have had finance charges of 207k just 24 months ago. The same purchase today incurs finance fees of 600k over the 30 years. So, a $500k house now effectively costs you $1.1 million over its financing period.

Household Interest Expense has risen to the highest level ever recorded.

American Credit Card delinquencies hit a record high of 7.2% at small banks during the first quarter.


The early stages of a credit downturn see interest rates rising even further leading to business failures. Essentially, the central banks lose control over interest rates.
A decade of negative real interest rates has been the best breeding ground for the growth of "Zombie companies". Now with the return to positive real interest rates, what will happen when these companies have to refinance their debt?


Crypto News
=> The U.S. Treasury Department has revealed its crypto tax plan, clarifying tax reporting obligations for the industry. The proposed rule introduces a new "broker" definition, including centralized crypto exchanges, payment processors, and some hosted wallet providers for tax obligations. Notably, miners are exempt from these rules.
However, "some" decentralized finance platforms will face reporting requirements. A new tax form, 1099-DA, will be introduced for these brokers. The crypto industry will have time to adapt, with a comment period and hearings before finalization, as the move addresses tax evasion risks while accommodating privacy concerns and technical issues.
=> Crypto asset manager Hashdex has applied a unique approach to a Bitcoin futures ETF that involves spot Bitcoin. Unlike previous filings, Hashdex won't rely on the Coinbase surveillance sharing agreement but will acquire spot Bitcoin from the CME market's real-world exchanges.
This approach could align with the SEC's concerns about manipulation and liquidity. Hashdex's strategy involves using EFRP transactions to exchange futures contracts for comparable spot exposure. Experts suggest higher chances of SEC approval due to regulatory pressure.
=> USDC, the second-largest stablecoin, is set to expand its presence by launching on six additional blockchains, including Polygon PoS, Base, Polkadot, NEAR, Optimism, and Cosmos, bringing its total networks to 15. This move aims to enhance cross-chain interoperability, making USDC more accessible for seamless transactions. Meanwhile, the expansion aligns with growing regulatory clarity for stablecoins.
=> Bitstamp, a major crypto exchange, is stopping Ethereum (ETH) staking for its US users on September 25 due to regulatory uncertainties. Users have until the deadline to earn rewards on their staked ETH. This decision follows Bitstamp's suspension of trading for seven altcoins, including Polygon and Solana, declared "unregistered securities" by the SEC. The move aligns with a trend of exchanges adjusting services due to regulatory challenges in the United States.
=> Following OKX and KuCoin, Bitget announced that it will strengthen its KYC policy. From October 1st, users who have not completed Level 1 KYC verification will only be able to withdraw funds, cancel orders, and close positions. To complete Level 1 KYC, you need to submit government-issued documents and face recognition.
=> Crypto exchange FTX has encountered a cybersecurity breach involving claims agent Kroll, revealing limited, non-sensitive customer data of specific claimants tied to the ongoing bankruptcy case. FTX assured customers that account passwords, systems, and funds remain secure.
The exchange quickly communicated the breach via its X platform to customers, creditors, and the public. Kroll is informing affected parties about protective measures, while FTX clarified that the incident occurred at Kroll and its own systems were unaffected.
=> The cryptocurrency exchange Binance has lost some business with payment card networks Mastercard and Visa.
The development is a sign of how traditional financial institutions are growing wary of working with the company as it faces intense regulatory scrutiny and wider concerns around financial compliance within the crypto industry.
=> According to WSJ, the U.S. DOJ is investigating whether Binance may violate U.S. sanctions against Russia. Binance provides Russian customers with at least five sanctioned Russian banks for payments. Binance responded that it follows global sanctions rules and imposes sanctions on blacklisted individuals, organizations, entities and countries.
=> Solana Pay, a decentralized payment protocol by Solana Labs, has integrated its plug-in with Shopify, allowing millions of businesses on its platform to use it for payments.
Going with USDC first wasn’t unintentional. Most merchants are probably more willing to accept something so closely tied to the dollar. USDC is also more regulated than, say, many altcoins, and consumers in general are already used to transacting in digital dollars
=> Popular meme-coin Pepe (PEPE) has plunged by about 20% in 4 days due to alarming events, unsettling the cryptocurrency community. Concerns about a multisig wallet's security, unusual token transfers, and the specter of a potential "rug pull" by the developers have emerged.
A whole $16 million worth of Pepe tokens was transferred from developers' multi-signature wallets to various exchanges, sparking speculation of developers offloading holdings and destabilizing the token’s value. Changes to the wallet's security protocol, requiring only two out of eight signatures, further fueled concerns about a possible exit strategy by developers.
Cryptos: spot, derivatives and “on chain” metrics
Earlier in the summer, Bitcoin got a burst from several developments seen as positive for the industry. Most notably, traders took heart from a flurry of applications, led by BlackRock, to launch what would be the first US exchange-traded funds tied to the spot price of the token. A district court decision seen as favorable to Ripple Labs in its legal fight with the Securities and Exchange Commission also buoyed the broader market. Some of the enthusiasm around that news is now fading, as traders settle in to wait for a decision on spot Bitcoin ETF approvals and the SEC prepares an appeal against the court decision on Ripple, with an outcome in the case not expected until next year.
Bitcoin, the largest crypto token, was down 0.32% for the week. In the past two weeks, it has fallen almost 12% after trading sideways for about a month. The pullback was also partly due to a broader correction in risk assets such as equities, induced by frothy positioning in tech, higher US real yields and growth concerns about China.
Ethereum, the second biggest cryptocurrency by market capitalization, matched Bitcoin’s pace. At its current price of $1,655, it is down 1.2% from last week. Broadly speaking, most top thirty cryptocurrencies retained their value. The only notable depreciation over the last seven days fell upon holders of Uniswap (UNI) and Avalanche (AVAX). AVAX fell 7.2% to $10.02, while UNI crashed 7.9% to $4.58.
Gainers / Losers last 7 days, block size volume.

Bitcoin
Spot market volumes at multi-year lows combined with growing derivative volumes, leverage and open interest in addition to volatility near multi-year lows, was akin to lighting a match near a pile of dynamite and waiting for ignition. Furthermore traditional markets have been weak the last two weeks with SPX and tech selling off, 10-year rates reaching highs and the dollar catching a bid, and China credit and econ data weakness, all of which are negatives for risk assets.
We have been warning for weeks about the following: “...as long as the price remains above the high volume node of $28100 and the Vwap anchored to the previous local highs, the long scenario should be maintained. However, it is vital for the bulls to regain the upper volume node of $30,250 in order to be able to continue to raise bullish scenarios….”
Two weeks ago in a single session we lost all short-term buying controls, the upper Vpoc $28100, the Vwap anchored at the previous highs and the Vwap anchored at the lows of the rally that began in early March of this year. If the market fails to recover this last commented Vwap (marked in white) it seems inevitable that the market will try to test the $23000 lower volume node. After the deep sell-off, the market had no reaction, no classic “buy the dip” at all, leaving the market in a clear situation of weakness.
It is now up to demand to really prove that this was a derivative liquidation event, and to do so it must reconquer the above high volume node $28100. Our bias as long as it does not achieve all of the above is bearish with targets of the $23000 levels.
Bitcoin 14/08/23 30 min chart

Bitcoin 21/08/23 30 min chart

Bitcoin 28/08/23 30 min chart

Moving up the timeframe is where we see the impact of this sharp sell-off. If the market consolidates the decline below $28100 and the VWAP marked in blue, the risk of a failed bullish imbalance is greatly increasing. An imbalance failure of a structure generally results in a return to value, i.e. a return to the inside of the accumulation range initiated after the FTX event. Should this return to value occur after the failure of the bullish imbalance, the bulls will have to react vigorously, otherwise the market could be in real trouble.
Bitcoin 21/08/23 4h chart

Bitcoin 28/08/23 4h chart

Sell off “On Chain” metrics
In the shorter-to-medium term, a developing derivatives market on top of the spot market can lead to large dislocations that result in unexpected volatility, with the market trading aggressively in one direction or the other to resolve the imbalance.
Short volatility strategies, whether simple or complex, are essentially bets on lower and/or stagnant volatility in the future. In this case, observing the trend in bitcoin's implied volatility through the Volmex Bitcoin Implied Volatility Index (BVIV), we can conclude that selling or shorting volatility became a popular trade over the summer months, as in the case of all other risk assets, effectively restricting the bitcoin market to a given price range.

Looking at Deribit, the primary options marketplace for bitcoin/crypto, the spread between their perpetual swaps market and the spot bitcoin market widened massively as implied volatility expanded. Participants who had been making money by shorting or selling volatility were got caught off guard, leading to a massive dislocation and liquidation event.

All that being said, this wasn’t just an options-driven event. There was growing leverage in the futures market as well. Spot market volumes at multi-year lows combined with growing derivative volumes and open interest in addition to volatility near multi-year lows, was akin to lighting a match near a pile of dynamite and waiting for ignition.
Total open interest for bitcoin, a measure of the total futures contracts outstanding, fell by just under $1.5 billion across Bybit, Binance, OKX and Deribit. Open interest across large-cap digital assets, meanwhile, fell between 2% and 25%.


The bitcoin led sell-off drove futures open interest weighted funding rates into negative territory, dipping to its lowest point since March, CoinGlass data shows.


Options Implied Volatility has more than doubled from 24% to over 55%.

Biggest single-day increase in Bitcoin implied volatility of the entire year.

Netflow: After a substantial market sell-off, Bitcoin’s Netflow has dropped from 3,992 to -3,847. The Exchange Netflow is calculated as the difference between the inflow and outflow of BTC on exchanges. A negative netflow at present implies a period of selling for Bitcoin’s price.

NUPL Ratio: Bitcoin’s NUPL ratio (Net Unrealized Profit and Loss) declined from 0.29 to 0.22 after the BTC price broke below the $28.7K region. However, when we see a trend of decreasing values, it means that more people who own coins are experiencing losses.

This situation also suggests that there’s less motivation to sell these coins at a loss, which reduces the overall pressure to sell. Moreover, it shows that the total value of coins being used and sold is higher than their current market value, making it less appealing to sell them in the market.
Long-Term Holder SOPR: Interestingly, the long-term holder SOPR remained stable above level 1 despite the recent market decline. This suggests that long-term holders (>155 days) are still selling at a profit.

We are certainly concerned that the spot market is so muted. Looking at the spot vs. derivative ratio, we see that derivatives are leading market movements. We now need to see strong activity in spot after the wild derivatives liquidation movement of the last few weeks.

Expectations around the Blackrock ETF spot triggered a considerable increase in tokens held by digital asset holders such as trusts, ETFs and funds. However, following recent news reports, it appears that these institutions are unwinding their holdings.

Ethereum
After crashing back into the Vwap anchored at all time highs, the market has returned with vigor to the demand zone between $1700 and $1500. After the sell-off two weeks ago, the market reaction in the demand area has been quite poor. This zone is key, as the loss of this zone would mean that sellers are back in control.
Ethereum 21/08/23 4h chart

Ethereum 28/08/23 4h chart

BNB
We will closely monitor the evolution of BNB as a measure of risk perception. BNB is the cryptocurrency coin that powers the BNB Chain ecosystem. BNB is one of the world's most popular utility tokens and it is used primarily to pay transaction and trading fees on the Binance exchange. It is Binance's flagship token.
At first glance we note that the Vwap anchored at highs has never been exceeded or practically tested since late 2021. The vigorousness with which the Vwap anchored at the local lows of June 2022 has been broken through makes us aware of the major weakness on this token.
Clearly, the area to watch is the historical support at $220 and we are already in this area with little reaction, from there Binance could start to have problems. We believe it is very necessary to follow very closely the evolution of this token, as it could anticipate a new CEX crisis.
BNB 21/08/23 4h chart

BNB 28/08/23 4h chart

Classic markets
Nineteen trading sessions have come and gone in August without a single back-to-back gain in the SP 500. If that continues, it will be the first month without two consecutive up days since April 2002, during the bear-market that followed the bursting of the dot-com bubble and the Sept. 11 terrorist attacks.
The pattern illustrates the lack of conviction among investors after the sharp run-up fueled by artificial intelligence breakthroughs, better-than-expected earnings and speculation the Federal Reserve would shift to cutting interest rates once the economy cooled. By the end of July, the SP 500 had risen almost 30% off its October lows. By the start of the month, the SP 500 was less than 5% away from retracing its record high, despite deep uncertainty about the economy. Then came a combination of rising yields, interest-rate anxiety and weak seasonal patterns that gave skeptics the upper hand.
Many held out hope for help from Nvidia, a major force in the AI-fueled tech-stock surge. But even a blowout forecast from the chipmaker Wednesday wasn’t enough to rekindle it. The other times when the SP 500 went this long without two consecutive up days occurred during turbulent times. It happened during the pandemic’s first wave in March 2020 and before that in October 2018, when concern about slowing growth ratted investors. In 2015, the SP 500’s first real down year since the great financial crisis, a streak of at least 25 days without back-to-back up days happened twic
The mood has since shifted as the surprising resilience of the economy and sticky inflation have markets expecting the Fed to hold rates high. On Friday, Chair Jerome Powell reinforced that conviction during a long-awaited speech in Jackson Hole, Wyoming, where he emphasized that the central bank stands ready to keep raising interest rates, if needed, to keep pulling down inflation.
Treasuries are decisively breaking below the levels that triggered the recent banking issues. Here is a reminder that the inflated valuation of financial assets hinges on a low cost of capital environment, a circumstance that no longer holds true today. Investors are starting to grasp the significance of structurally elevated discount rates but there is a long way to rectify these deeply ingrained valuation imbalances.


The SP 7, a handful of technology stocks, are now up an incredible 54% this year. 3 weeks ago, the SP 7 was up a massive 70%. Meanwhile, the remaining S&P 493 is up just 4%. These same stocks have accounted for 75% of the ENTIRE Nasdaq's gain this year. Even with recent volatility, technology stocks are still holding up the entire market. Markets are betting on AI and they are all-in.


The SP500 equity risk premium, or difference between earnings yield and 10yr Treasury yield, recently touched the lowest level since 2003.

Stocks are deeply disconnected from macroeconomic data.

Relative to M2 money supply, the S&P 500 is trading at the exact same level as July 2007.

Low quality stuff continues trading well offered. MEME and most shorted stocks at new recent lows.


Summary of Nvidia earnings:
1. Record revenue of $13.5 billion, up 101% YoY
2. Adj. earnings per share of $2.70, up 429% YoY
3. Record data center revenue of $10.3 billion
4. Announced a massive $25 billion stock buyback
5. Sees Q3 revenue of $16 billion, 28% above expectations
6. Beat all headline expectations AND raised guidance
The stock is now up 250% YTD and the best performer in the SP 500.
But the day after Nvidia's results were released, the stock had what we call a "outside reversal.". NVDA shares were up +8% on the open. It gave back all its gains on massive volume by the close. It pancaked down to 0.1%. Up 8% to 0.1%
Nvidia's valuations speak for themselves:
Nvidia's P/E: 48.9x 10Y average: 33.1x
Nvidia's EV/EBITDA: 59.9x 10Y average: 30.2x
Nvidia's Price to Sales: 23.4x 10Y average: 10.4x
Nvidia's Price to Free Cash Flow: 235.1x 10Y average: 50.5x

If NYFANG is the AI proxy, then NVDA has gone beyond the AI hype

Aggregate equity positioning has dropped for 4 straight weeks.

This is the single most important chart for now, It shows total systematic exposure. What does it tell? Markets have dropped during the past few weeks and systematics have sold and as we know they still have some more to sell.

When we look at global systematic macro positioning, which is a combination of CTA, risk parity and volatility control funds, it was recently at levels not seen since late 2021. Another extreme, and one that suggests some level of left tail fattening in the event of a de-risking in equities. In that momentum shifting lower could add to selling pressure as these funds reduce their long exposure.


Despite some modest selling from both CTA's and Vol control funds over the past few weeks, Tier1 Alpha Systematic Positioning Index is still high in the 80%ile. That leaves a substantial amount of deleveraging risk on the table if volatility levels escalate from here.

This is the largest selling event we've seen from vol control funds since late 2022, with an estimated $28B of selling flow hitting the market.

Vulnerable to volatility. Volatility control funds have high equity exposure and volatilities have risen. Goldman Sachs.

Goldman's CTA model continues to show wild downward asymmetry.

During the last 3 weeks, the sequence of failed rallies and new lows was a challenge to trade. The slow bleeding to the downside can be explained by the market continuing to try to maintain its status quo and play the same dynamics that have been working so well lately, crunch volatility and put squeeze.
The market, having overcome OPEX and NVDA's results, has not found catalysts to reverse August's downtrend. As we will see by analyzing the gamma profile of the market, the market has only been defending itself from falling further from the 4350 - 4400 points zone. If the market does not find real demand in this zone, a risk off window not seen for months will open. Many CTA models estimate that the large unwind trigger for long positions in risky assets is below 4300 points.
The market after distributing at highs leaving a really dense effective imbalance has gone to reach the nearest previous volume zone. Once it reached this zone, with some dilation below, the demand took control momentarily, finding rejection in the Vwap (green) anchored at the highs. If the bulls do not accumulate and develop to the upside at this volume node of 4400 points and consolidate above this green Vwap we can assume that this has been a stop on the way with poor demand response. Undoubtedly a dangerous situation in which the market finds itself.
We maintain our bearish bias as long as the market does not surpass the green VWAP anchored at the highs, understanding that last week was a new attempt by the market not to lose this important zone of 4400 after several weeks of strong selling pressure.
28/08/23 SP500 4h chart. Big picture

07/08/23 SP500 futures small picture

14/08/23 SP500 futures small picture

21/08/23 SP500 futures small picture

28/08/23 SP500 futures small picture

The market is defending itself in the 4350-4400 point zone and last week it managed to withstand a bearish attack. As can be seen in this short-term chart, losing the Vwap (red) anchored at local lows and the buying control of 4390 would imply further clear sell-offs.

Gamma Profile 14/08/23

Gamma Profile 21/08/23

Gamma Profile 28/08/23

The market during OPEX was attracted to the 4350 strike. Once the expiration passed and the corresponding gamma was released, buyers took control until hitting the zero gamma level (flip point). At the start of this week we are again facing another test of this flip point. If the bulls want to reverse this situation they have to consolidate above this level, if this does not happen, and this is what seems most likely, the negative gamma of the market will do its job.

It is now important to monitor how extreme the bearish sentiment in options positioning is in order to be prepared for potential short squeezes. The SPY Skew shows that we are still far away from the bearish panic zone, but we have reached an important inflection point for the market, the 250-day average of this Skew (yellow level). At the same time, implied volatility, despite the rises of the last 4 weeks, is far from previous extreme readings. Therefore, everything seems to indicate that there could be more downward movement with less risk of short squeeze based on the metrics shown below.


