.png)


.png)
Summary
Fueled by inflation data and credit rating downgrades for several U.S. banks, the indexes saw ups and downs. Markets gained ground to start the week, but the SP500 and Nasdaq fell for a second week in a row.
Inflation in the United States, as measured by the Consumer Price Index, came in at 3.2% in July on Thursday, slightly below market expectation. Core inflation, which excludes energy and food, rose 0.2% for the month, the same rate as in June. This suggests that price pressures are moderating, a development that could lead the Fed to consider pausing rate hikes.
Moody’s cut the credit rating of 10 small and midsize U.S. banks on Monday, noting it has several larger lenders under review. The move from the ratings agency reflects the challenges the banking industry still faces, including increased lending costs and dampening profitability.
China’s exports fell by 14.5% in July compared with a year earlier, the biggest decline since February 2020; imports dropped by 12.5% for the same period. The declining imports and exports figures released on Tuesday added to the country’s waning economic woes, which slipped into deflation for the first time in more than two years.
This coming week could be one of the last busy weeks of this earnings season, with reports from major retailers including Walmart, Home Depot, and Target. On Tuesday, the Census Bureau will issue data on nationwide retail sales for July, indicating whether consumer spending held up last month. On Wednesday, the Federal Reserve will release minutes from the latest FOMC meeting, which could offer clues as to the trajectory of monetary policy. The latest updates on the housing market will include building permits and housing starts for July, and the NAHB’s Housing Market Index for August. Lastly, we’ll get inflation and GDP readings from the U.K., Eurozone, and Japan.
In the crypto ecosystem we highlight that PayPal has launched its own stablecoin, PYUSD, which is pegged to the US dollar and can be used on its platform to buy, sell, and hold digital currencies. This is a major development as it makes it easier for people to use cryptocurrency in their everyday lives.
In other news, Bittrex has agreed to pay a $24 million fine to the SEC for operating an unregistered exchange. Meanwhile, DCG, the parent company of Grayscale Investments, is suing Gemini, alleging that the latter made false statements about its compliance with regulations.
Similarly, the SEC has filed an interlocutory appeal in the Ripple case and has delayed a decision on the Ark21 Shares Bitcoin ETF, while Fireblocks has also revealed vulnerabilities in over 15 crypto wallets.
The U.S. Federal Reserve (Fed) is starting a new program to oversee banks’ crypto activity, and it further clarified its requirement that the lenders under its authority get approval before engaging in digital-assets activities. The Fed also issued a fuller explanation for how the banks it supervises need to get preapprovals for engaging with stablecoins. An institution that’s “issuing, holding or transacting in dollar tokens to facilitate payments” needs to prove to the supervisors beforehand that it can do all of that in a “safe and sound manner” and needs the Fed to formally sign off.
Macro y news

With most of the world enjoying the holiday season, here are some of the most important events for the coming months:
AUGUST
▪18: Biden, Yoon & Kishida meeting at Camp David
▪️22-24: BRICS Summit
▪️23: NVDA earnings
▪️24-26: Fed Economic Symposium at Jackson Hole
▪️31: US PCE
SEPTEMBER
▪️1: Employment report
▪️9-10: G20 Summit
▪️13: US CPI
▪️14: UAW Labor Union contract w GM, Ford, Stellantis
▪️20: FOMC
▪️29: PCE
▪️30: End Government Fiscal Year. $1.2T of T-Bill issuance needed by then
OCTOBER
▪️1: Student Loan payments due (unless taking 1 extra year interest accrues)
▪️6: Employment report
▪️9-15: IMF World Bank meeting
▪️12: US CPI
▪️27: US PCE
NOVEMBER
▪️1: FOMC
▪️3: Employment report
▪️14: US CPI
▪️30: US PCE
Earnings for this coming week:

U.S Macro data
The week’s economic calendar was relatively light overall but included some closely watched inflation data. The Labor Department’s consumer price index (CPI) rose 0.2% in July, bringing its year-over-year increase to 3.2%, a tick below expectations. A sharp drop in airline fares helped compensate for continuing pressure from shelter costs.


Producer prices rose 0.3% in the month, a tick above expectations. On a year-over-year basis, producer prices rose 0.8%, well below the Federal Reserve’s overall consumer inflation target of 2%. July marked the first annual increase in the rate of producer price inflation in over a year, however.
U.S PPI (mom) (jul) actual: 0.3% vs 0.1% previous; est 0.2%
U.S PPI (yoy) (jul) actual: 0.8% vs 0.1% previous; est 0.7%
U.S CORE PPI (mom) (jul) actual: 0.3% vs 0.1% previous; est 0.2%
U.S CORE PPI (yoy) (jul) actual: 2.4% vs 2.4% previous; est 2.3%

A major point of concern for the Fed has been wage inflation. We are seeing wage inflation decline but the level is still not commensurate with a 2% inflation target. The Employment Cost Index, for one, needs to be between 2%-3%.

Credit rating agency Moody’s Investors Service downgraded 10 regional banks and put six other lenders on notice that they are under review, the latest blow to an industry still reverberating from the March banking crisis that led three firms to collapse.
The targeted banks remain vulnerable to nervous depositors and investors, risks from higher interest rates, and a weakening commercial real estate market, Moody’s said. Some of those conditions helped spark the panic this spring that brought down Silicon Valley Bank and Signature Bank, respectively the second- and third-largest bank failures in U.S. history.
Also Moody’s assigned a negative outlook to 11 more banks, meaning their ratings could be downgraded in the medium to long term. That group also included some of the nation’s biggest lenders, including PNC Financial Services Group, Capital One and Citizens Financial.

The week also brought a somewhat mixed inflation outlook from Federal Reserve officials. Over the previous weekend, Fed Governor Michelle Bowman warned that further hikes might be needed, while New York Fed President John Williams suggested that rate hikes were nearing their end and that rate cuts might be coming as soon as 2024. On Tuesday, Philadelphia Fed President Patrick Harker stated that he was comfortable keeping rates steady for now, while Richmond Fed President Thomas Barkin suggested he was also in favor of a pause in the hiking cycle.
Eurozone macro data
The Italian government announced at the start of the week that it would tax 40% of net interest margins earned by banks in either 2022 or 2023, saying lenders had failed to pass on enough of their profits to depositors. The unexpected move triggered the largest drop in banking stocks since March, when two U.S. regional lenders collapsed, and UBS stepped in to buy ailing Credit Suisse. The reaction prompted the Italian government to issue a clarification the next day, saying it would cap any levy at 0.1% of risk-free assets.
Germany: Industrial output drops again in June
Industrial output dropped 1.5% in month-on-month terms in June, which was a deterioration from May's 0.1% decrease. The weakening was partly due to a deterioration in manufacturing production.

Consumer price inflation in France slowed down to 4.3% last month from 4.5% in June, with energy prices falling by 3.7% year on year. Food prices, on the other end, were still 12.7% higher in July 2023 than a year before. Core inflation, which excludes prices subject to state intervention and products with highly volatile prices, fell from 5.7% in June to 5.0% in July year on year.
The Spanish consumer price index (CPI) grew 2.3% from a year ago, faster than June's 1.9% increase. The annual increase was driven by the 10.8% increase in food and non-alcoholic beverages prices. Meanwhile, housing cost plunged 14.9% and transport cost was down 5.3%. Underlying inflation rose to a three month high of 6.2% in July from 5.9% in the previous month.

The European Central Bank (ECB) said in its latest Economic Bulletin that, since the June interest rate hike, developments have supported the expectation that inflation should moderate in 2023 but still stay above the 2% target for an extended period. The publication indicated that the near-term economic outlook for the euro area had deteriorated due to weaker domestic demand. Even so, the ECB believes the outlook for inflation and economic growth remains highly uncertain. The comments raised expectations that policymakers could press pause on monetary tightening in September.
UK macro data
UK gross domestic product (GDP) grew 0.5% sequentially in June, exceeding a consensus forecast for a 0.2% expansion. Strong increases in manufacturing and construction were important drivers. Second-quarter GDP surprised to the upside, growing 0.2% versus the previous three months, thanks, in part, to better-than-expected private consumption. Business investment rose strongly as well, defying forecasts for a modest contraction.


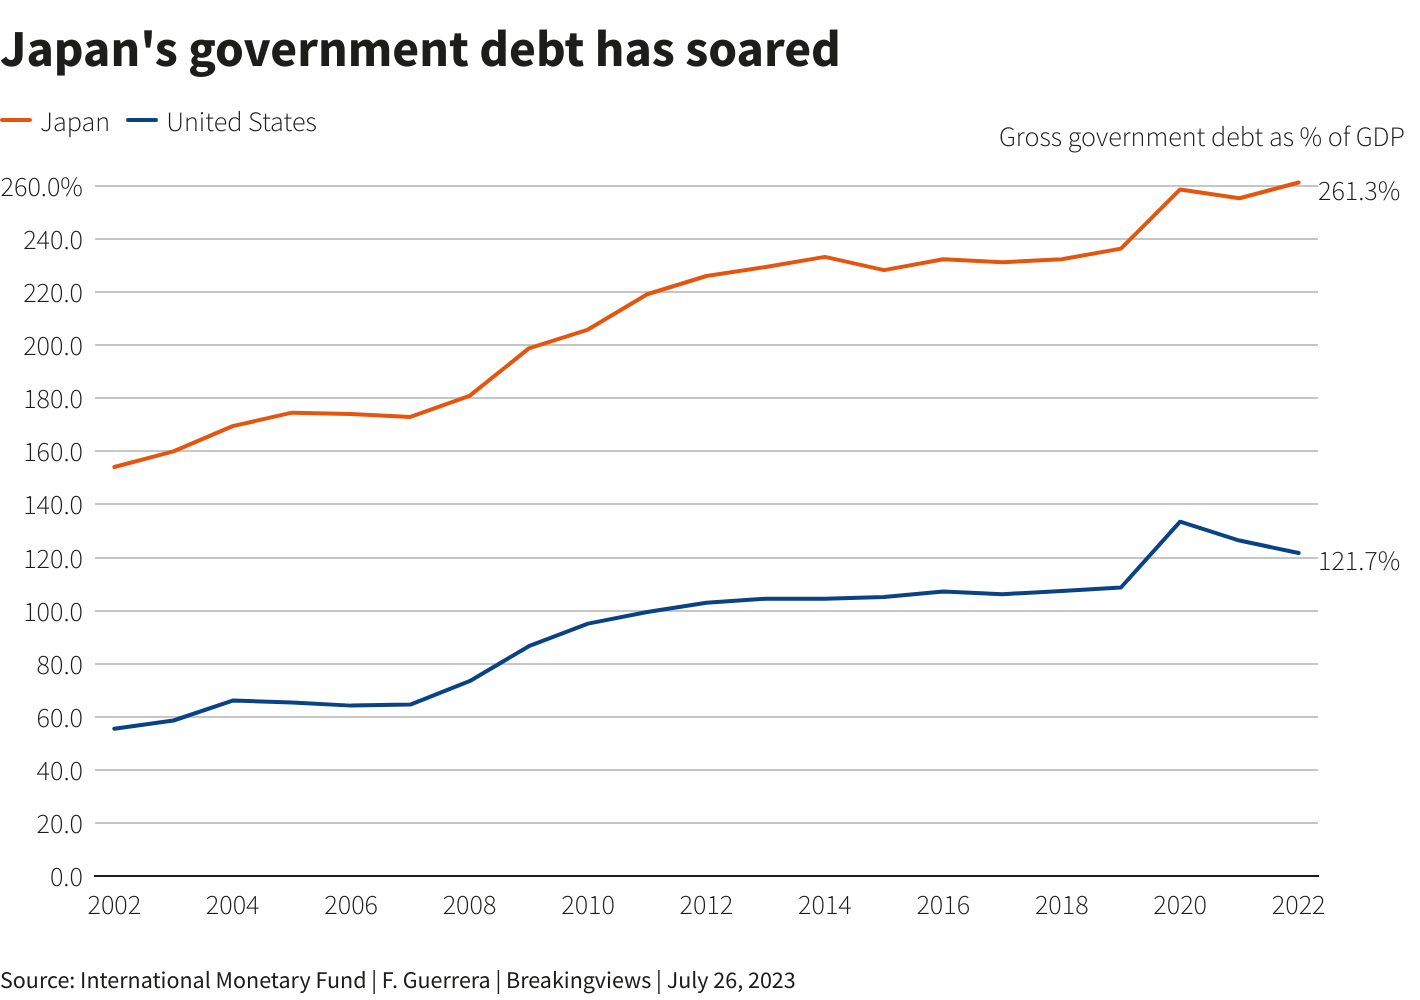
Japan macro data
The yield on the 10yr Japanese government bond (JGB) fell to 0.58%, from a nine-year high of 0.65% at the end of the previous week. Yields across the curve were affected by a stronger than expected outcome of a 30-year bond auction during the week. The Bank of Japan (BoJ) tweaked its monetary policy in July to allow yields to rise more freely but has indicated that it will not tolerate a rapid move in yields.
The consumer goods price index, an indicator of inter-company pricing for goods and services, rose 3.6% year on year in July, marking the seventh straight month of slowing wholesale inflation. The slowdown was due largely to weaker energy utility costs.
Japan machine tool orders:

The Summary of Opinions at the BoJ’s July monetary policy meeting indicated that the board members believe there is a long way to go to achieve inflation accompanied by wage increases. Determining whether wage hikes will continue next year will be a key issue. Until the likelihood of achieving the 2% inflation target rises sufficiently, the BoJ needs to maintain yield curve control while conducting it with greater flexibility.
Japan's debt relative to the size of its economy is the largest in the world, 263% .If the Bank of Japan lets the yield on the 10 yr bond rise to 1% (which is exactly what it has said it intends to do over the next few months), the cost of paying interest on Japan's debt would rise to 3.6 trillion yen by fiscal 2026. That expense would represent 22.1% of its 114 trillion yen national budget for this year, just insane!
China macro data
China’s latest inflation data revealed that consumer and producer prices fell in tandem for the first time since November 2020, underscoring the weak demand throughout the economy. The consumer price index declined 0.3% in July from a year earlier and slipped into contraction for the first time since February 2021. The producer price index fell a worse-than-expected 4.4% from a year ago but slowed from June’s 5.4% decline.

The release reinforced concerns that China has entered a deflationary period, which offset optimism about Beijing’s latest efforts to prop up demand after the State Council announced new measures last month to boost consumer spending.
Trade and lending data for July came in below expectations and underscored the loss of momentum in China’s post-lockdown recovery.
Exports fell a larger than expected 14.5% in July from a year earlier, marking the weakest reading since the start of the pandemic in early 2020. Imports shrank by a worse-than-expected 12.4%, almost double the drop recorded in the previous month.
China's July trade balance at $80.6 bln in USD term.
Exports -14.5% yoy, Est. -13.2%
Imports -12.4% yoy, Est. -5.6%


China’s property crisis worsened as state-backed developer Sino-Ocean Group Holdings missed interest payments and shares in developer Country Garden slumped further after it suspended trading of some onshore bonds. The default comes amid a deepening crisis in the property market, after Chinese developer Country Garden announced over the weekend it would suspend trading of at least 10 onshore bonds issued in 2021 and 2022 starting from Monday.
The developer’s liquidity crunch is adding to concerns about the potential drag the industry will have on growth in the world’s second-largest economy, sending a Bloomberg index of the country’s junk dollar bonds to the lowest level since last year on Thursday.
Regulators across China’s government have been seeking since late last year to revive demand in the real estate sector, which makes up about a fifth of China’s gross domestic product. Measures such as easing mortgage rates on first-home purchases have so far failed to stem the crisis, with home sales tumbling the most in a year in July.


China's economy increasingly resembles that of 2015-2016, characterized as the China Growth Scare. Manufacturing PMIs below 50, Imports and exports falling, and a slowdown in the real estate sector. In fact, concerning the latter, things look much worse now. Will China pull the global economy into recession now that the biggest global monetary tightening cycle ends?
Bonus macro data: US credit markets begin to speak for itself
A storm of public and private debt is brewing in the US and the troubles are already beginning to show on the surface as loans pile up and borrower confidence falters. At a broad level, Fitch Ratings' downgrade of the US credit rating and Moody's downgrade of 10 US banks this summer points to issues for both US sovereign credit (political polarization hampering the US's ability to meet debt obligations) and debt originated out of the banking sector (structural pressures stemming from tighter credit conditions and Fed policy).
But there are more granular problems mounting across debt markets as well, as both private and public sectors face a drastically different environment than they did in the previous decade when interest rates were at historic lows coming out of the 2008 crisis. If low rates spurred the sugar rush of heavy borrowing, rising interest rates may be setting the stage for the sugar crash.
Small banks now hold a massive $1.9 Trillion of commercial real estate (CRE) loans.This is up nearly $1 trillion since 2017 while large bank exposure stood flat. CRE is also dealing with mass vacancies and prices are down 20%+ in 1 year. Over $1.5 Trillion of CRE loans are due to be refinanced by 2025. Many of these loans have seen rates nearly double.

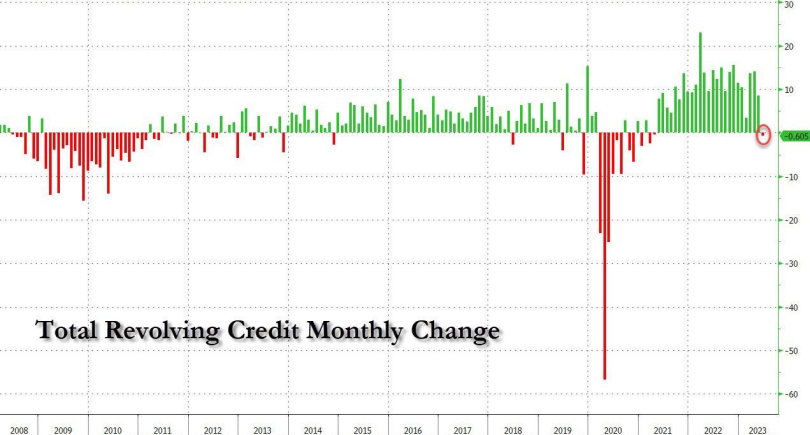
Total household debt rose by $16 Billion to reach $17.06 Trillion in the second quarter of 2023. Mortgage balances were largely unchanged but Credit card balances increased by $45 billion, a 4.6% quarterly increase, and now stand at $1.03 trillion.


New data from the Fed shows the total number of credit card accounts is still rising quickly. For the first time in history, the US is set to cross over 600 million credit card accounts. That would mean ~2.3 credit card accounts per US adult. Meanwhile, the average American now has $7,300 in credit card debt. Meanwhile the rate of new credit card delinquencies hit 7.2% in the second quarter, up from 6.5% in the first quarter, according to the Moody's report, which was based on household debt data published earlier this week by the New York Federal Reserve.


In the US, interest rates on household items are skyrocketing. In just 1 year, the average interest rate on credit card debt has gone from 14% to 21%+. New car loan rates went from 4% to 8% while used car loan rates are at 12%+.

According to Bankrate.com‘s data, US 30yr fixed-rate mortgage reached 7.53% on Friday, the highest rate since October 2000.

For the first time in 2.5 years, credit card debt fell in June by $605 million. At first, this seems like a great sign after credit card debt has soared to record highs. But, what does it mean when consumers drastically cut spending? The two last times we saw periods of large drawdowns in credit card debt were 2008 and 2020. Now we watch to see if it becomes a trend in 2023.
Thanks to the rise in interest rates and some shakiness in the banking system earlier this year, many banks are second-guessing their loans to smaller businesses. They’re not only looking at their customers’ deteriorating order books, but they’re also concerned about these customers’ ability to pay back their loans given the huge jump in financing costs. As a result, and as shown in these data, 49% of banks have now tightened their lending to small businesses, compared to 22% a year ago.

High Yield issuance at maturities greater than 8 years has dropped to an all-time low in 2023.

Higher interest and tighter credit means fewer loans overall. And that’s exactly what we’re seeing. Loan volume has decreased dramatically over the past year and continues to trend down. We live in a capitalist society, and loans are one of the main sources of capital that finance investment, property deals, equipment purchases and working capital. Loans should not be going down in a growing economy. Businesses borrow to expand and support their growth. Clearly this is going in the opposite direction.

In the latest Senior Loan Officer Opinion Survey (SLOOS) reflecting 2Q23 lending conditions, lending standards tightened across nearly all categories for the fourth consecutive quarter. Banks expect to tighten lending standards further across all loan categories through year-end, with the most tightening in commercial real estate (CRE), followed by credit card and commercial & industrial (C&I) loans to small firms. The survey also asked banks to describe current lending standards relative to the midpoint of standards since 2005. Most banks indicated that lending standards are tighter than the historical midpoint for all categories of C&I and CRE
Crypto News
The world of cryptocurrencies has not been on vacation, this week we found some important news.
=> Paypal has launched its own stablecoin called PYUSD for payments and transfers. The ERC-20 stablecoin is issued by Paxos Trust Company and is backed by U.S. dollar deposits, short-term U.S Treasuries and similar cash equivalents.
PYUSD is available to U.S. customers gradually and can be transferred between PayPal and compatible external wallets. It can also be used to send person to person payments, fund purchases by selecting it at checkout and convert any of PayPal’s supported cryptocurrencies to and from PYUSD.
=> Visa tests ways to make paying Ethereum gas fees easier. The payments company said blockchain technology could “shape the future of money movement” and has gained significant adoption in the past few years. However, facilitating transactions on-chain remains too complex for most users.
To bridge the gap, Visa suggests leveraging Ethereum’s ERC-4337, the current standard that enables smart contracts on the blockchain to serve as wallets via a process called "account abstraction," and a paymaster contract,a smart-contract account that can sponsor gas fees on behalf of the user. The service would allow users to use a Visa card to pay directly for gas fees.
=> The US Federal Reserve (FED) announces a new program for oversight of cryptocurrency activities. FED now requires approval before state banks can issue, hold or transact crypto stablecoin payments.

FED says state member banks should receive written “non-objection” from fed before issuing, holding or transacting in dollar tokens.

=> The SEC has settled with the Bittrex crypto exchange and its former CEO. Accused of running an unregistered exchange, Bittrex must pay over $14.4 million in disgorgement, $4 million in prejudgment interest, and $5.6 million in civil penalties, awaiting court approval. This settlement follows the US Treasury Department's $29 million enforcement in 2022, which prompted Bittrex's US exit and subsequent bankruptcy filing.
=> The SEC aims to challenge Ripple Labs' court victory through an "interlocutory" appeal. The SEC's recent letter to Judge Analisa Torres requests a case suspension to seek this review. Citing the Terraform case, the SEC argues for an appellate court's fresh evaluation because of conflicting judgments. The essence lies in Torres's decision to categorize XRP sales as non-securities.
While the recent partial victory deemed retail XRP sales non-securities, this "interlocutory" twist adds a layer of uncertainty, prolonging the legal showdown's timeline.
=> The Sec has delayed a decision on approving or disapproving the spot Bitcoin exchange-traded fund (ETF) proposed by ARK Investment Management.
The SEC opened a 21-day comment period for the ARK 21Shares Bitcoin ETF to the public following publication in the Federal Register, the latest delay for the regulator determining whether to approve or disapprove of a spot crypto ETF in the United State
For a listing on the Cboe BZX Exchange, an applicant must provide evidence of a “comprehensive surveillance-sharing agreement in place with a regulated market of significant size.” The SEC has previously rejected the firm’s crypto ETF proposals, claiming they would not be “designed to prevent fraudulent and manipulative acts and practices” or protect investors.
=> Digital Currency Group (DCG) has responded to Gemini's lawsuit, branding it as a continuation of a PR strategy. The crypto venture firm filed a motion to dismiss the suit, asserting that Gemini's claims lack substance and are an attempt to tarnish DCG's image.
The lawsuit from Gemini alleges DCG's involvement in fraudulent practices tied to the collapsed Earn program, operated by DCG subsidiary Genesis. The suit unfolds amidst regulatory scrutiny, with both companies facing SEC charges over unregistered securities sales.
=> Spanish football titan FC Barcelona has secured a staggering €120 million ($132 million) investment from Libero Football Finance AG and Nipa Capital B.V. The influx fuels Barça Vision's Web3 journey, integrating blockchain, NFTs, and the metaverse for the digital Espai Barça. Libero and Nipa, renowned in finance and venture capital, drive this evolution. Pending shareholder approval, the transaction concludes in Q4 2023.
=> Coinbase’s Base mainnet launches to the public with 100+ dApps, lower fees, and faster transactions. Over $139 million has already been deposited pre-launch, offering an improved user experience. Based on Optimism’s technology, the network focuses on scalability, decentralization, and zkEVM integration.
=> Crypto infrastructure leader Fireblocks has unearthed "BitForge" vulnerabilities, targeting over 15 digital asset wallet providers. According to the company, this flaw could trigger a complete drain of crypto wallets. Categorized as "zero-day," these vulnerabilities affect essential cryptographic MPC protocols such as GG-18, GG-20, and Lindell 17 implementations.
Cryptos: spot, derivatives and “on chain” metrics
The crypto market closes a largely uneventful and somewhat positive week. August started sluggishly for most assets as they tried to overcome their recent losses. Most cryptocurrencies are back trading in the green, albeit not by much. The market capitalization increased by around $10 billion.
Bitcoin has been on a slippery slope for several weeks, taking it below the $29,000 level. However, the king of cryptocurrencies made a recovery this week, going as far as challenging $30k again. Unfortunately, BTC could not climb above the much coveted level. Ethereum also returned to its gaining ways by increasing slightly over the week. Still, its 1% value boost is not enough to rekindle optimism for the second crypto in command. Most altcoins are trading in the green, although only a few record considerable growth. For example, Shiba Inu is up by 9% and records a third consecutive week of solid gains.
Gainers / Losers last 7 days, block size volume.

Bitcoin
Bitcoin starts the third week of August with barely a sound as range bound price behavior continues. Bitcoin is suffering from a clear case of suppressed volume, leading volatility to head back to its lowest-ever levels. Realized volatility for Bitcoin has collapsed to historical lows.
As we said last week, as long as the price remains above the high volume node of $28100 and the Vwap anchored to the previous local highs, the long scenario should be maintained. However, it is vital for the bulls to regain the upper volume node of $30,250 in order to be able to continue to raise bullish scenarios.
Bitcoin 07/08/23 30 min chart

Bitcoin 14/08/23 30 min chart

Moving up the timeframe, the scenario of effective bullish imbalance of the entire lower value area is still on the table. The verticality of the rise leaving a somewhat inefficient auction and the clash with the third typical deviation of the main Wwap are the only impediments to further upside for the time being. The market must hold the $28100 level and remain above the Vwap anchored at the previous local highs, losing this zone would put an end to any bullish continuation scenario.
Bitcoin 07/08/23 4h chart

Bitcoin 14/08/23 4h chart

Volatility Crush: Glassnode insights
https://insights.glassnode.com/the-week-onchain-week-32-2023/
Bitcoin prices are infamously volatile, however the market is currently experiencing an extreme volatility compression. Whilst options markets reflect this, it suggests that Bitcoin is either no longer infamously volatile... or volatility could be mispriced.
It has been 842 days since the bull market peak was set in April 2021. The 2023 recovery is actually faring somewhat better than the last two cycles, trading -54% below the ATH, compared with -64% historically. 2015-16 and 2019-20 cycles experienced a 6-month period of sideways boredom before the market accelerated above the -54% drawdown level. This is perhaps an indication of the boredom which may lie ahead.

After a blazing hot start to 2023, both the quarterly and monthly price performance has cooled off. We can again see many similarities to prior cycles where the initial rally off the bottom is powerful, but leads into an extended period of choppy consolidation.

Bitcoin realized volatility ranging from 1-month to 1-year observation windows has fallen dramatically in 2023, reaching multi-year lows. The 1y volatility window is now at levels not seen since December 2016. This is the fourth such period of extreme volatility compression:
- The late stage 2015 bear into the 2016 re-accumulation period.
- The late stage 2018 bear which preceded a 50% sell-off in Nov. This was however followed by the Apr 2019 recovery rally, rising from $4k to $14k over three months.
- Post March 2020 consolidation as the world adjusted to the outbreak of COVID-19.
- The 2022 end of year break as the market digested the FTX failure, and our current market (see WoC 2-23 for our analysis in January 2023).

This quiet spell is also visible across derivatives markets for both BTC and ETH. The combined Futures and Options trade volume for the two assets are at, or approaching all-time-lows for Ethereum and Bitcoin, respectively.
BTC is currently seeing $19.0B in aggregate derivatives trade volume, whilst ETH markets have just $9.2B/day, taking out the Jan-2023 lows.

Open interest Bitcoin in futures markets has also been relatively flat at $12.1B over the last month. These are similar levels to the second half of 2022 when prices were ~30% cheaper than today and the FTX exchange was still active. It is also similar to during the Jan-2021 run-up when prices were 30% higher, the market was less mature, and leveraged speculation was only just heating up.

Options markets have seen a significant uptick in dominance and growth, with open interest more than doubling over the last 12-months. Options now rival futures markets in terms of open interest magnitude.

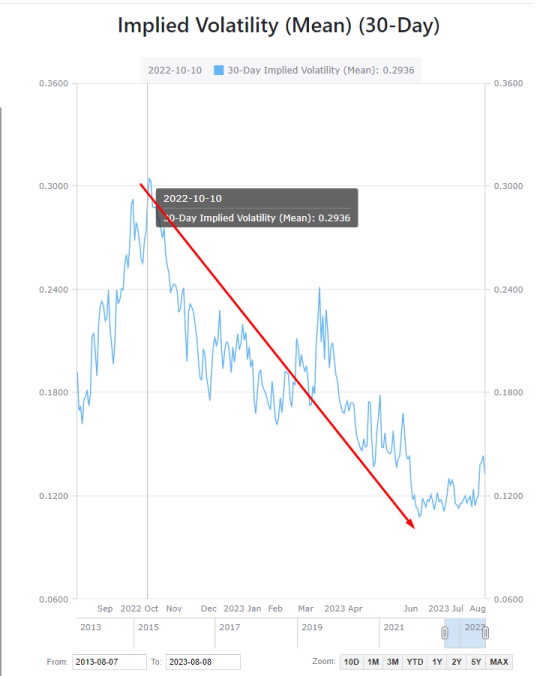
Moving across to options markets, and we can see just how severe the volatility crush has been, with implied volatility across all contract expirations collapsing to all-time lows. Bitcoin markets are infamously volatile, with options trading at an implied volatility between 60% to over 100% for the majority of 2021-22. However at present, options are pricing in the smallest volatility premium in history, with IV between 24% and 52%, less than half of the long-term baseline.

The Put/Call Ratio across both volume and open interest metrics are at, or near all-time lows, trading between 0.42 and 0.48. This suggests that there is a net bullish sentiment within the market, and demand for call options continues to dominate.

As a result, put options are increasingly cheap relative to calls, reflected by an all-time-low in the 25-delta skew metric. Overall, this indicates that options markets, which now rival futures markets in size, are pricing in historically low volatility on the road ahead.

Ethereum
No relevant changes for Ethereum that continues to resist breaking the Vwap anchored at all time highs. We need to see a real change of character, breaking this level in a strong way to build solid and consistent long scenarios. Any loss of buying response in the $1700 - $1500 area would set off all alarms.
Ethereum 07/08/23 4h chart

Ethereum 14/08/23 4h chart

BNB
We will closely monitor the evolution of BNB as a measure of risk perception. BNB is the cryptocurrency coin that powers the BNB Chain ecosystem. BNB is one of the world's most popular utility tokens and it is used primarily to pay transaction and trading fees on the Binance exchange. It is Binance's flagship token.
At first glance we note that the Vwap anchored at highs has never been exceeded or practically tested since late 2021. The vigorousness with which the Vwap anchored at the local lows of June 2022 has been broken through makes us aware of the major weakness on this token.
Clearly the area to watch is the historical support at $220, from there Binance could be in serious trouble.
BNB 07/08/23 4h chart

BNB 14/08/23 4h chart

Classic markets
After a remarkably strong rally to start the year, markets have given back a bit in August thus far, with the SP500 down around 3% since its recent high on July 31. Underneath the surface, however, we see the Nasdaq is down over 4.0% during this period, and the "Magnificent 7" large cap stocks are down over 5.0%.
If we look at absolute valuations for the SP500 (PE ratios: this chart is showing the average of the forward PE, trailing PE, CAPE vs history) they are clearly expensive, and if you look at the equity risk premium (shown inverted, which basically shows the relative value of equities vs bonds) it’s also showing stocks as expensive vs bonds.

SP500 trailing P/E requires EPS to grow nicely in 2024, but we don’t see much EPS growth. The following chart shows the SPX P/E ratio too high vs US Financial Conditions.

Tech valuations got back to those crazy 2020/21 pandemic liquidity frenzy levels and a key difference now is the record pace and magnitude of monetary tightening globally vs easing back then.

More than 40% of the companies in Russel 2000 have negative earnings. These are levels not seen since the peak of the pandemic, but more importantly the height of the great financial crisis of 2008.

Rules-based “systematic” flows are largely what's behind the year to date rally in equities, despite deteriorating economic data. What are systematic flows? Well, an overwhelming amount of stock market “flow” each day is driven by strategies, like Commodity Trading Advisors (CTAs), Risk Parity and Volatility Control funds, that explicitly target levels of volatility to determine buying and selling decisions. To simplify in a rough way, when volatility is falling, these strategies buy, when volatility is rising, these strategies sell.
For now, CTA & Volatility control funds reflect extreme downside convexity, Global CTA equity exposure is near all time highs, same goes for US CTA exposure.


These flows matter, because they can become self-reinforcing (which is what’s happened year-to-date). To grossly oversimplify, after stratospheric levels of volatility in 2022, volatility had begun to fall at the outset of 2023, which led systematic volatility targeting strategies to buy, which led to falling volatility, which led to more buying.

Nomura's CTA model shows that CTAs have already reduced their aggregate exposure to global equities by nearly -$30B in the past 2 weeks and largely evenly split between Asia, Europe and North America as short-term models have missed previous "long" signals on this pullback in recent days / weeks.

According to Goldman Sachs these are the key SP500 levels to watch as the market remains under some pressure:
- 4457: Short-term CTA momentum turns negative and will unlock $5bn of total SP500 supply over the next 5
sessions (4278 is the really important one here, where medium-term momentum turns negative).
- 4427: 50 dma (hasn't broken to the downside since March)

Volatility is a player on the field and is no longer the coach. Strategies targeting volatility remain in the 99% percentile over the last 10 years.

SP500 0DTE options volume as a percentage of total options was 55% on the day of the CPI release and also the day before, which are both all-time highs as a percentage 0DTE of total options volume. This is a clear driver of the intraday volatility we are seeing so far in the month to date because of the Dealer's intraday hedging market.

However, according to Nomuera, selling 0DTE puts to finance 0DTE calls has stopped working lately. Note that selling 0DTE puts is still the winner.

Since the data began to be collected in 2008, the cost to hedge SP500 downside protection has never been cheaper.

US markets ended mostly lower on Friday with the SP500 and the Nasdaq registering their second straight weekly loss. This was the first instance in 2023 when the tech-heavy Nasdaq fell for two weeks in a row. The last instance of the index falling two weeks or more was back in December 2022.
During the last 2 weeks, the sequence of failed rallies and new lows was a challenge to trade. The slow bleeding to the downside can be explained by the market continuing to try to maintain its status quo and play the same dynamics that have been working so well lately, crunch volatility and put squeeze. However this week we have OPEX, options expiration will have a lot to say again.
The upper zone of the stock has finally resolved as distributive very quickly but leaving a very “dense” effective bearish imbalance. Our bias remains bearish with targets at the lows of the recent momentum (around 4400 points). Reversing the recent selling pressure is a complicated task for the bulls. In our opinion, as long as the market remains below the Vpoc of the current minor downtrend, 4525 points and the Vwap (green) anchored at the impulse highs, the scenario is short. The nearest bigger volume node is at 4400 points, it should act as a magnet.
07/08/23 SP500 futures small picture

14/08/23 SP500 futures small picture

We just had the first negative market gamma reading of the quarter on Thursday, and then an even stronger negative market gamma reading on Friday. The longer the market remains trapped in negative market gamma territory, the more dangerous it gets because there is more opportunity for fragility (from declining liquidity and shock absorbing gamma) to meet a burst of systematic market risk or other kind of momentum event.


The call option walls moved lower again, but the big changes occurred in the major put option walls, which moved significantly lower. This dynamic should be interpreted as a bearish signal when key levels move lower. The strike with the highest gamma notional remains 4400, observing also a large generation of open interest on the put side throughout the week. The market is already in a negative gamma regime, which translates into increased volatility. The 4400 strike should act as a magnet for OPEX.
At the same time, 4400-4450 points are considered an important zone for the positioning of the CTAs, which from this level onwards would proceed to massively unwind their long positioning.
Gamma Profile 07/08/23

Gamma Profile 14/08/23

It is now important to monitor how extreme the bearish sentiment in options positioning is in order to be prepared for potential short squeezes. The SPY Skew shows that we are still far away from the bearish panic zone, but we have reached an important inflection point for the market, the 250-day average of this Skew (yellow level). At the same time, implied volatility, despite the rises of the last two weeks, is far from previous extreme readings. Therefore, everything seems to indicate that there could be more downward movement with less risk of short squeeze based on the metrics shown below.


It is worth noting the slope of the SPY gamma curve, which accelerates from 440 points. If the market were to break this level, the flow coming from the hedging of the Market Markers (MM) could severely accelerate the falls. Remember that in a market in negative gamma, the movements are exacerbated because the MM cover in favor of the movement, volatility kicks in!

We have observed in the last two sessions significant purchases of Calls strikes 23, 24 and 28 for September and October, position opening. This risk purchase or hedging should not be news, but in the context in which we have been for weeks if not months, it is certainly something to be noted.


